- Quant AMC equity funds have an impressive 5-year return performance in lump sum and SIP investments.
- Last year was not very impressive for SIP investment returns; none of the equity funds older than five years are in the top quartile.
In the world of mutual funds, consistency and outperformance are the holy grail. Investors seek funds that can deliver impressive returns while navigating the complexities of the market. Our journey begins with a simple question: Does Quant AMC possess the magic formula for market mastery?
To uncover the truth, we embarked on a rigorous analysis, scrutinizing funds with a proven track record of at least five years. The study was done on regular growth funds.
We gathered data and calculated key performance metrics:
-
Lumpsum returns over 1, 3, 5, and 10 years.
-
XIRR (Extended Internal Rate of Return) to account for the Systematic Investment Plan (SIP) prevalent in India.
-
Percentile rankings to evaluate funds within their respective categories.
quant AMC has eight equity funds that are older than five years. The table below shows the lumpsum return of those funds:
| Fund Name | Category | 1Y Return | 3Y Return | 5Y Return | 10Y Return | 1Y Percentile | 3Y Percentile | 5Y Percentile | 10Y Percentile |
|---|---|---|---|---|---|---|---|---|---|
| quant Elss Tax Saver Fund | ELSS | 50.40 | 26.24 | 37.58 | 24.74 | 85.00 | 93.94 | 100.00 | 100.00 |
| quant flexi cap fund | Flexi Cap Fund | 55.50 | 25.90 | 37.35 | 22.54 | 85.71 | 88.89 | 100.00 | 100.00 |
| Quant Focused Fund | Focused Fund | 49.41 | 24.22 | 27.35 | 19.45 | 85.71 | 81.82 | 93.75 | 100.00 |
| Quant Large & Mid Cap Fund | Large & Mid Cap Fund | 56.64 | 28.99 | 30.66 | 21.60 | 88.46 | 100.00 | 100.00 | 100.00 |
| Quant Mid Cap Fund | Mid Cap Fund | 50.61 | 31.91 | 38.95 | 21.28 | 48.15 | 95.45 | 100.00 | 82.35 |
| Quant Active Fund | Multi Cap Fund | 41.65 | 22.52 | 33.91 | 21.54 | 18.18 | 62.50 | 100.00 | 100.00 |
| Quant Infrastructure Fund | Sectoral/ Thematic-Infrastructure | 66.60 | 32.23 | 40.05 | 21.70 | 76.47 | 41.18 | 100.00 | 100.00 |
| Quant Small Cap Fund | Small Cap Fund | 55.37 | 31.72 | 50.20 | 22.67 | 78.26 | 95.24 | 100.00 | 83.33 |
- The 5-year and 10-year returns are among the best in their respective categories, and seven funds are the best with perfect 100 percentile in the respective fund categories for 5-year returns and six funds have 100 percentile in 10-year returns.
- The shorter investment period is a mixed bag, out of eight funds only one fund has a perfect 100 percentile for 3-year returns, and six funds in total are in the first quartile.
- In the case of 1-year return six funds are in the first quartile, one fund in the bottom quartile, and one fund in the third quartile, no fund has a perfect 100 percentile.
The below table shows the SIP XIRR of eight equity funds of quant AMC.
| Fund Name | Category | 1Y XIRR | 3Y XIRR | 5Y XIRR | 10Y XIRR | 1Y Percentile | 3Y Percentile | 5Y Percentile | 10Y Percentile |
|---|---|---|---|---|---|---|---|---|---|
| quant Elss Tax Saver Fund | ELSS | 41.82 | 34.10 | 38.13 | 27.26 | 37.50 | 84.85 | 100.00 | 100.0 |
| quant flexi cap fund | Flexi Cap Fund | 47.69 | 36.83 | 38.58 | 26.07 | 68.57 | 88.89 | 100.00 | 100.0 |
| Quant Focused Fund | Focused Fund | 42.97 | 32.95 | 31.04 | 21.01 | 38.46 | 77.27 | 87.50 | 100.0 |
| Quant Large & Mid Cap Fund | Large & Mid Cap Fund | 46.13 | 37.48 | 34.50 | 23.05 | 46.15 | 88.46 | 100.00 | 100.0 |
| Quant Mid Cap Fund | Mid Cap Fund | 41.94 | 39.28 | 40.45 | 26.20 | 7.41 | 63.64 | 95.00 | 100.0 |
| Quant Active Fund | Multi Cap Fund | 34.25 | 29.82 | 33.82 | 24.63 | 4.55 | 12.50 | 85.71 | 100.0 |
| Quant Infrastructure Fund | Sectoral/ Thematic-Infrastructure | 46.08 | 40.27 | 44.57 | 28.04 | 5.88 | 23.53 | 100.00 | 100.0 |
| Quant Small Cap Fund | Small Cap Fund | 47.49 | 43.03 | 49.98 | 29.04 | 52.17 | 90.48 | 100.00 | 100.0 |
- All funds for SIP XIRR of 10 years have a perfect 100 percentile. As the investment period becomes smaller, performance becomes poorer.
- For the last 5-year investment period, all funds are in the top quartile.
- For the last 3-year period, two funds are in the bottom quartile.
- For 1-year period no funds are in the top quartile, and three funds are in the bottom or fourth quartile.
The detailed analysis for each fund is below sections:
quant Elss Tax Saver Fund
In the world of investments, a star emerged: the Quant ELSS Tax Saver Fund. This fund's remarkable journey was marked by impressive returns, outpacing its peers and solidifying its position as a leader in the ELSS tax-saving category.
A Stellar Track Record
Over one year, the fund delivered an astonishing 50.4% return, surpassing the category average of 43.37%. This exceptional performance continued over three, five, and ten years, with returns of 26.24%, 37.58%, and 24.74%, respectively. Each milestone exceeded the category averages, demonstrating the fund's consistent excellence.
A Top Performer
The Quant ELSS Tax Saver Fund's ranking told the story of its success:
-
85th percentile over one year
-
93.94th percentile over three years
-
100th percentile over five and ten years
This fund stood tall among its peers, showcasing its ability to generate impressive returns across various time frames.
SIP XIRR Returns
Investors who opted for the Systematic Investment Plan (SIP) were also rewarded:
-
One-year XIRR: 41.82% versus the category average of 44.16%
-
Three-year XIRR: 34.1% versus 29.95%
-
Five-year XIRR: 38.13% versus 27.05%
-
Ten-year XIRR: 27.26% versus 18.66%
While the one-year XIRR was slightly lower than the category average, the fund's long-term SIP returns shone, securing top rankings:
-
37.5th percentile over one year
-
84.85th percentile over three years
-
100th percentile over five and ten years
The Quant ELSS Tax Saver Fund's remarkable performance and consistent top rankings make it an attractive choice for investors seeking growth and tax savings.
quant Elss Tax Saver Fund lumpsum investment return and performance in the ELSS tax saving category.
| quant Elss Tax Saver Fund | 1Y | 3Y | 5Y | 10Y |
|---|---|---|---|---|
| Fund Returns | 50.4 | 26.24 | 37.58 | 24.74 |
| Category Average Return | 43.37 | 19.95 | 23.06 | 16.42 |
| Category Max Return | 68.57 | 28.25 | 37.58 | 24.74 |
| Category Min | 25.88 | 10.68 | 16.49 | 13.12 |
| Fund Return Percentile in Category | 85.0 | 93.94 | 100.0 | 100.0 |
| In The Top Quartile in Category | Yes | Yes | Yes | Yes |
quant Elss Tax Saver Fund SIP XIRR and its performance among peers.
| quant Elss Tax Saver Fund | 1Y XIRR | 3Y XIRR | 5Y XIRR | 10Y XIRR |
|---|---|---|---|---|
| Fund Returns | 41.82 | 34.1 | 38.13 | 27.26 |
| Category Average Return | 44.16 | 29.95 | 27.05 | 18.66 |
| Category Max Return | 71.89 | 43.85 | 38.13 | 27.26 |
| Category Min | 23.4 | 23.17 | 20.0 | 14.29 |
| Fund Return Percentile in Category | 37.5 | 84.85 | 100.0 | 100.0 |
| In the Top Quartile in Category | No | Yes | Yes | Yes |
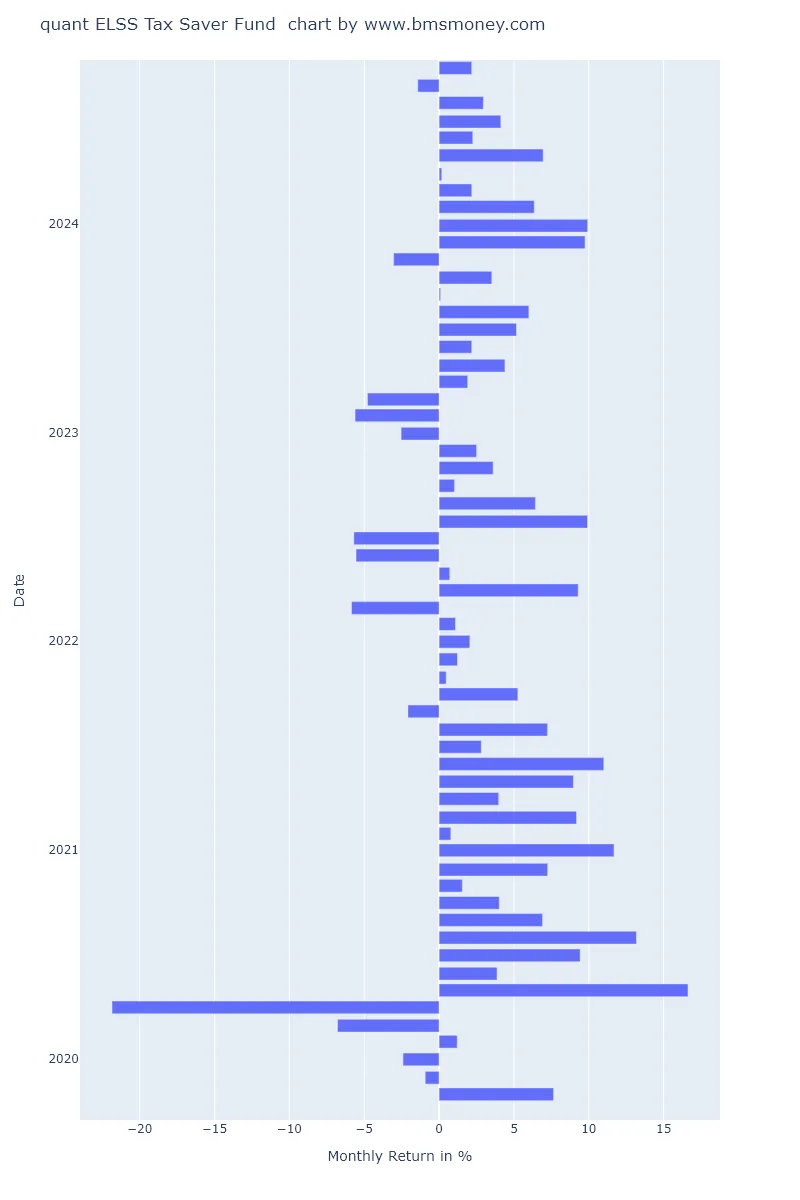
quant Elss Tax Saver Fund monthly return:

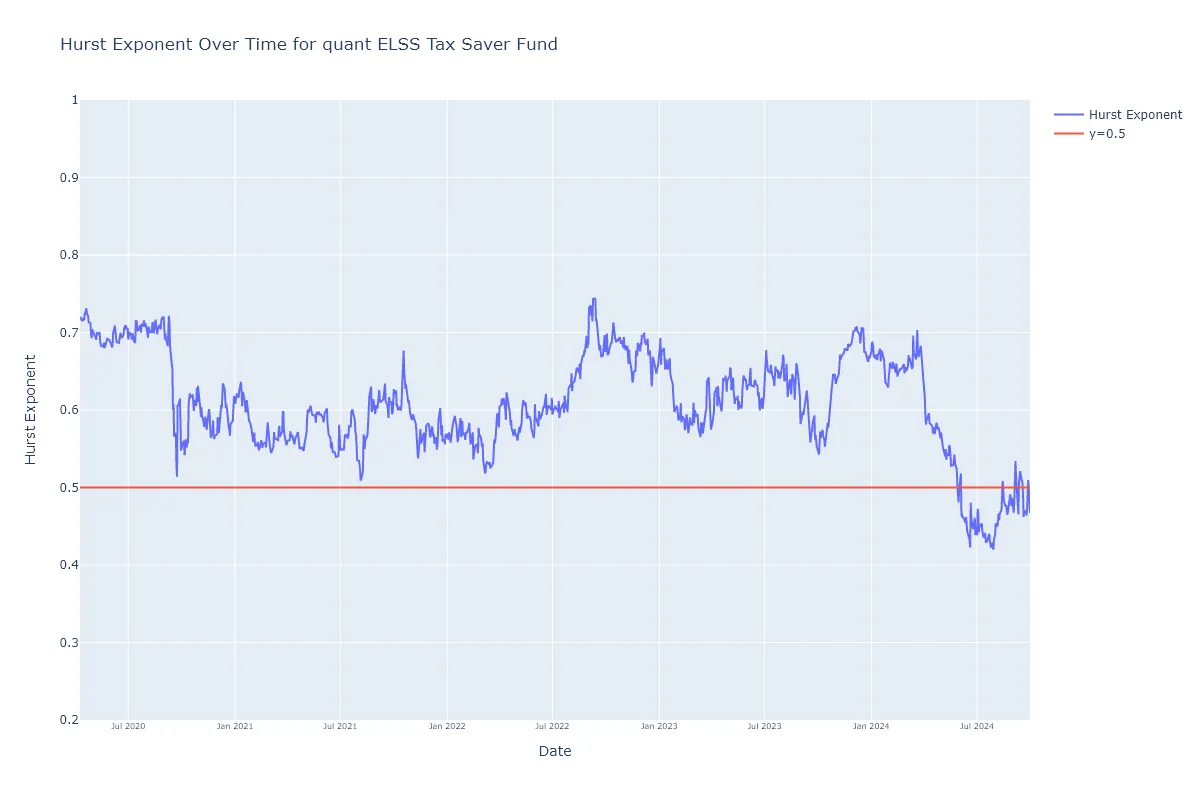
quant Elss Tax Saver Fund Hurst exponent:
Hurst Exponent
The Hurst Exponent (H) is a statistical measure used to analyze the long-term memory and fractal dimension of time series data, such as financial markets. Developed by Harold Hurst in the 1950s, it helps assess the predictability and volatility of a system.
Interpretation:
-
H = 0.5: Random walk, no memory or correlation (efficient market hypothesis)
-
H > 0.5: Long-term positive correlation, trending, and persistence (momentum)
-
H < 0.5: Long-term negative correlation, mean-reversion, and anti-persistence
Values:
-
0.0 < H < 0.5: Anti-persistent (reverting to mean)
-
0.5 < H < 1.0: Persistent (trending)
-
H = 1.0: Perfect positive correlation (deterministic trend)
Interpretation:
The Hurst exponent is calculated using data from the last five years and a lookback period of 128 trading days. As it can be seen in the chart the Hurst exponent remain above 0.5 till June 2024, after that it became volatile, showing SEBI enqury had some impact on investment decision making.

Top Performing Funds for You
Top Performing Equity Funds Top Performing Debt Funds Top Performing Hybrid FundsQuant Small Cap Fund
The Quant Small Cap Fund has been a standout performer in the small-cap space, consistently delivering strong returns across various time frames. This fund is suitable for investors with a higher risk appetite, as it has capitalized on the growth potential of small-cap stocks.
Fund Returns vs. Category
The fund's recent performance has been impressive:
- 1 Year: 55.37%, higher than the category average of 48.34%.
- 3 Year: 31.72%, surpassing the average of 26.21%.
- 5 Year: 50.2%, matching the category maximum.
- 10 Year: 22.67%, ahead of the category average.
Across all these periods, the fund ranks in the top quartile of its category, making it an excellent long-term performer.
SIP Returns (XIRR)
For systematic investors, the fund has also delivered robust results:
- 1 Year: 47.49%, slightly below the category average.
- 3 Year: 43.03%, much higher than the average of 36.78%.
- 5 Year: 49.98%, ranking at the top of its category.
- 10 Year: 29.04%, the highest in its category.
Analysis of Hurst Exponent
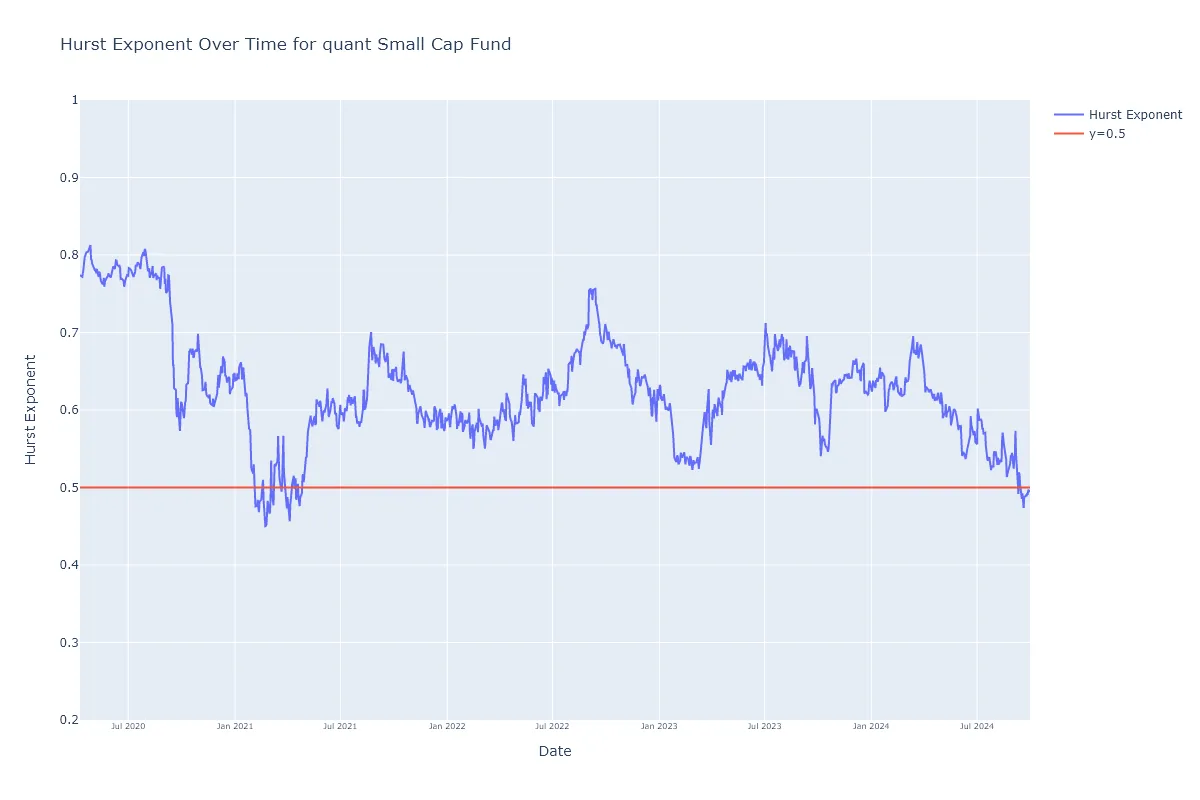
The Hurst Exponent is a key metric that indicates whether a fund’s price movements are persistent (values above 0.5), random (0.5), or mean-reverting (below 0.5). For the Quant Small Cap Fund, the Hurst Exponent has mostly fluctuated between 0.5 and 0.7 over the past few years, as shown in the chart. This suggests that the fund’s returns exhibit persistence—meaning past trends tend to continue, a favorable trait for momentum investors.
While volatility is present, particularly in the small-cap space, the persistence indicated by the Hurst Exponent reflects the fund’s ability to capitalize on upward trends. However, recent dips toward 0.5 signal that market conditions may be becoming more random, so investors should watch closely for momentum shifts.
Quant Small Cap Fund lumpsum investment return and performance in the small-cap category.
| Quant Small Cap Fund | 1Y | 3Y | 5Y | 10Y |
|---|---|---|---|---|
| Fund Returns | 55.37 | 31.72 | 50.2 | 22.67 |
| Category Average Return | 48.34 | 26.21 | 34.53 | 20.92 |
| Category Max Return | 74.68 | 32.08 | 50.2 | 24.71 |
| Category Min | 36.27 | 17.84 | 26.45 | 17.54 |
| Fund Return Percentile in Category | 78.26 | 95.24 | 100.0 | 83.33 |
| In the Top Quartile in Category | Yes | Yes | Yes | Yes |
Quant Small Cap Fund SIP investment return and performance in the small-cap category.
| Quant Small Cap Fund | 1Y XIRR | 3Y XIRR | 5Y XIRR | 10Y XIRR |
|---|---|---|---|---|
| Fund Returns | 47.49 | 43.03 | 49.98 | 29.04 |
| Category Average Return | 49.96 | 36.78 | 37.57 | 23.68 |
| Category Max Return | 78.97 | 50.69 | 49.98 | 29.04 |
| Category Min | 35.42 | 26.44 | 31.64 | 18.98 |
| Fund Return Percentile in Category | 52.17 | 90.48 | 100.0 | 100.0 |
| In the Top Quartile in Category | No | Yes | Yes | Yes |
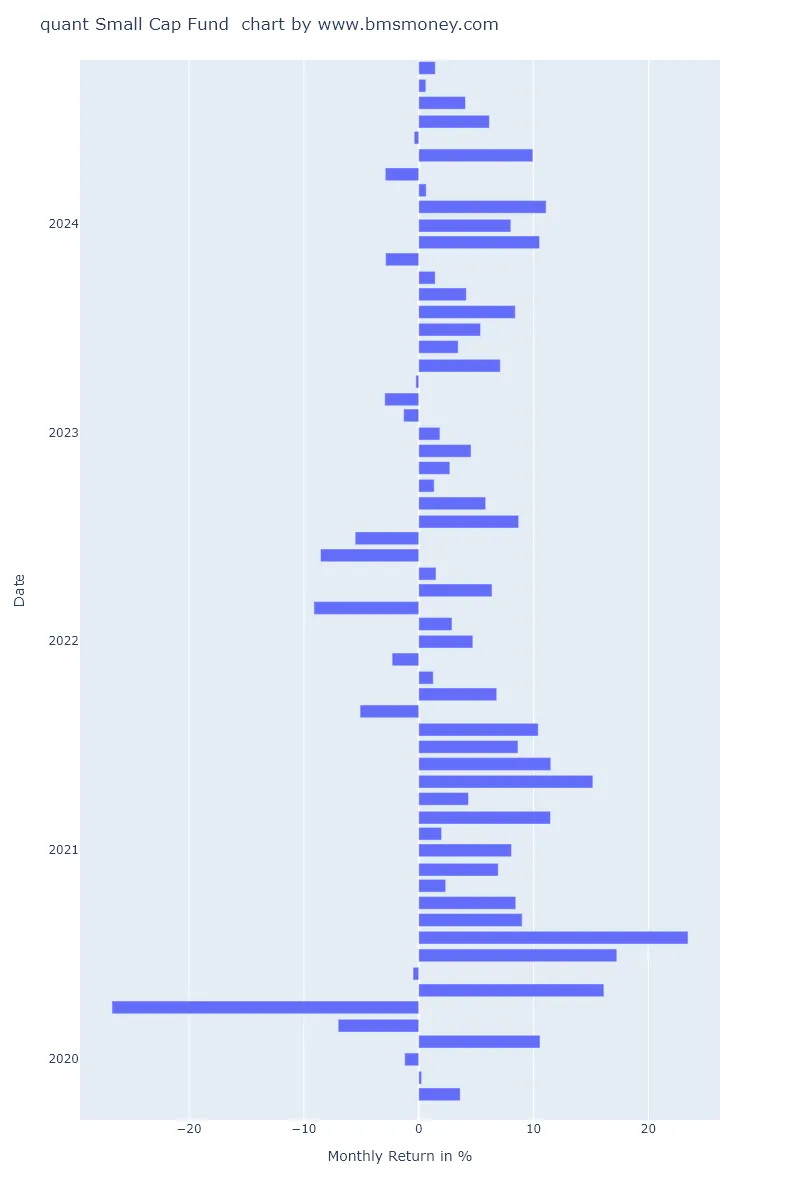
Quant Small Cap Fund monthly return.

