- In India currently, there are 22 small-cap funds. As on 30 September 2020, total asset under management (AUM) of small-cap funds was Rs. 53,175 Crores.
- The total market capitalization of small-cap companies between January and June 2020 was Rs. 1,429,948 Crores.
Like us on Facebook
Jump To:
Individual Fund Performance Analysis
Beginning of Analysis
Retail Investors Situation
In India currently, there are 22 small-cap funds. As on 30 September 2020, total asset under management (AUM) of small-cap funds was Rs. 53,175 Crores. The total market capitalization of small-cap companies between January and June 2020 was Rs. 1,429,948 Crores. Asset under the management of small-cap funds is 3.72% of total market capitalization. (it is not a correct way to calculate, but can be used for comparison with other fund categories).
Now take a look at AUM of large-cap funds, as on 30 September 2020, it was Rs. 145,396 Crores. The total market capitalization of large-cap companies between January and June 2020 was Rs. 10,125,721 Crores. AUM of the large-cap fund is 1.44% of the total market capitalization of large-cap companies.
The market capitalization of small-cap companies is 14.12% of the market capitalization of large-cap companies; however, AUM of small-cap funds is 36.58% of the AUM of large-cap funds. This looks funny; retail investors have more exposure to the riskiest fund category than less risky fund categories. Corporate investors normally invest in safer mutual fund categories.
| Category | AUM (cr) | Total Market Capitalization (cr) | AUM / Market Capitalization (cr) |
|---|---|---|---|
| Small-cap Fund | 53,175 | 1,429,948 | 3.72% |
| Large-cap Fund | 145,396 | 10,125,721 | 1.44% |
Based on the above data it can be concluded that retail investors have too much exposure to small-cap funds. Now the question arises did small-cap funds performed better than large-cap funds.
To do comparative performance analysis of small-cap fund with large-cap funds either we can compare the performance of all small-cap funds with the performance of all the large-cap funds or we can compare the performance of the benchmark indexes. Using indexes will make the analysis simple and understandable. I have selected NIFTY 50 TRI (Total Return Index), NIFTY Small-Cap 100 TRI, and NIFTY Small-Cap 250 TRI index as benchmark indexes. NIFTY 50 TRI is a large-cap index as everyone knows, the other two indexes are small-cap indexes.
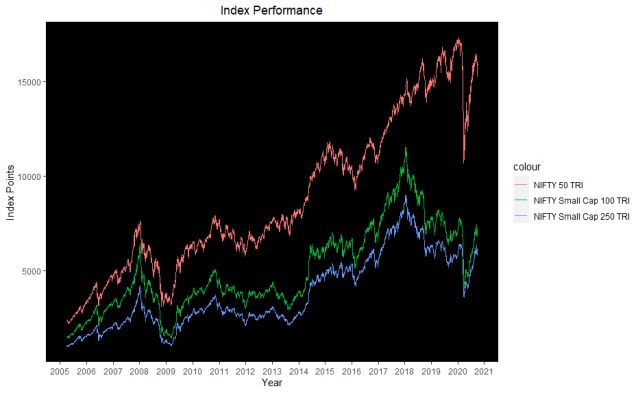
From the above chart, up to the great financial crisis (GFC) of 2008-09, NIFTY 50 TRI and small-cap indexes were moving in the same direction. However, in the financial crisis and after it, the relationship between NIFTY 50 TRI and small-cap indexes got broken. They were not moving at the same speed but still, they were moving in the same direction. The relationship completely broke down in around and of 2018 and start of 2019. Small-cap indexes fell off the cliff.
Small-Cap Funds V/S all Other Equity Fund Categories
Based on benchmark indexes performance it can be said that the small-cap fund category is not performing great. We can take a more detail look at the small-cap fund and other funds belonging to equity fund category. Date of analysis 30 September 2020.
| Fund Category | Drawdown Median | EVT VaR (95% 1Y) Median | Annual Return (last five year) |
|---|---|---|---|
| Technology Fund | -23.16% | -18.55% | 14.85% |
| Pharma Fund | -23.36% | -27.7% | 4.82% |
| Consumption Fund | -26.59% | -28.07% | 8.82% |
| Large-Cap Fund | -26.92% | 25.51% | 6.35% |
| Multi-Cap Fund | -28.57% | -27.36% | 6.24% |
| ELSS (Tax Saving Fund) | -28.7% | -27.96% | 6.9% |
| Focussed Fund | -29.11% | -26.99% | 7.46% |
| Contra Fund | -29.41% | -29.03% | 8.82% |
| Large & Mid-Cap Fund | -30.46% | -28.05% | 7.22% |
| Dividend Yield Fund | -31.84% | -26.1% | 7.03% |
| Mid-Cap Fund | -32.22% | 35.1% | 7.04% |
| Value Fund | -36.32% | 32.43% | 5.86% |
| Infrastructure Fund | -40.87% | -35.89% | 1.84% |
| Small-Cap Fund | -44.01% | -36.2% | 6.71% |
One can see from Table 2 small-cap funds have very high risk. The median drawdown (losses from top) of the small-cap fund category is the highest in equity category of funds. However, corresponding returns from this category of funds are not the highest. At the category level, small-cap funds are among the worst performers (considering both risk and return).
Like us on Facebook
Fund Performance
After taking a look at an aggregate level of the small-cap fun category; the next question from anyone will be what about the performance of individual funds in the small-cap fund category. Because all funds do not perform in the same way. Table 3 answer this question. In table 3, we have shown the performance of small-cap funds which are five or five+ years old. Date of analysis 30 September 2020.
| Fund Name | Launch Date | WA Return#% | 1Y Return % | 3Y Return% (Annualized) | 5Y Return% (Annualized) | Drawdown % | EVT VaR (95% 1Y) % | WA Risk$ |
|---|---|---|---|---|---|---|---|---|
| Quant Small Cap Fund | 23/9/1996 | 19.63 | 52.28 | 0.05 | 6.53 | -42.38 | -24.34 | -33.36 |
| Union Small Cap Fund | 20/5/2014 | 7.91 | 19.31 | .02 | 5.73 | -37.75 | -40.34 |
39.05 |
| DSP Small Cap Fund | 4/5/2007 | 7.67 | 17.61 | 0.00 | 7.54 | -45.05 | -40.88 | -42.96 |
| SBI Small Cap Fund | 27/7/2009 | 6.99 | 12.25 | 0.06 | 13.4 | -34.84 | -31.55 | -33.2 |
| Kotak Small Cap Fund | 30/12/2004 | 6.62 | 13.91 | 0.03 | 8.67 | -37.49 | -31.92 | -34.7 |
| Nippon India Small Cap Fund | 26/8/2010 | 6.51 | 12.34 | 0.03 | 10.92 | -42.97 | -43.16 | -43.06 |
| Axis Small Cap Fund | 11/11/2013 | 5.61 | 9.47 | 0.09 | 11.26 | -30.41 | -28.33 | -29.37 |
| ICICI Prudential Smallcap Fund | 23/8/2007 | 2.98 | 5.15 | 0 | 5.91 | -41.17 | -29.55 | -29.55 |
| HSBC Small Cap Equity Fund | 12/4/2005 | 2.67 | 5.44 | -0.05 | 3.93 | -52.1 | -41.76 | -46.93 |
| Sundaram Small Cap Fund | 3/1/2005 | 2.06 | 4.69 | -0.07 | 2.26 | -53.7 | -48.98 | -51.34 |
| L&T Emerging Businesses Fund | 22/4/2014 | 1.01 | -1.87 | -0.04 | 8.43 | -47.51 | -38.65 | -43.08 |
| HDFC Small Cap Fund | 11/2/2008 | 0.86 | -2.25 | 0 | 8.22 | -45.86 | -34.89 | -40.38 |
| Franklin India Smaller Companies Fund | 16/11/2005 | -0.6 | -4.1 | -0.05 | 4.31 | -46.89 | -31.38 | -39.14 |
| Aditya Birla Sun Life Small Cap Fund | 9/4/2007 | -2.88 | -0.64 | -7.84 | 4.36 | -54.75 | -37.52 | -46.13 |
# Weighted Average Return
- 1 Year Return Weight = 35%
- 3 Year Return Weight = 45%
- 5 Year Return Weight = 20%
$ Weighted Average Risk
- Drawdown = 50%
- EVT VaR (95% 1Y) = 50%
If we take a look at 3 years return in table 3, the returns are either zero or in negative meaning in the last three years non of small-cap funds have given any return to investors. Three funds have given decent returns in the last 1 year (17%+), the return of the remaining eleven funds are very poor. Performance of direct plan would be a little better compared to the regular plan discussed in table 3.
One can easily find better performing funds in other fund categories. Small-cap funds are not very good for investment, one or two funds may have given some returns in the last one year but overall small-cap fund category is not good for small investors.