From the analysis performed in this article, it can be said all funds will never give more return than the interest rate on FD. Fund performance analysis and fund selection will be very crucial for generating an extra return.
Like us on Facebook
Beginning of Analysis
Every mutual fund investor has one question before investing in any fund. Will I get more returns from this fund or will the fixed deposit (FD) generate more returns? However, there is no clear answer to this question. Normally, the proponent of mutual funds will say that mutual funds generate more returns compared to FD and will show the return of a few selected funds. Similarly, the proponent of FD will show you their set of data and say FD will give you more return.
FD has one advantage over mutual funds; in FD with any scheduled commercial banks like SBI, HDFC or Kotak Mahindra; depositors know beforehand the rate of return. They also know at the time of maturity, how much money they will get back from the FD.
In the case of mutual funds, investors don’t know the redemption amount in advance like FD, hence, they remain unsure how much return the fund will generate. However, it is said in general mutual funds will generate more returns compared to FD. In nutshell, the mutual fund works on the concept of expected returns whereas FD works on concept predefined returns.
So how do we answer the question “Do mutual funds generate more return or fixed deposits give more interest?”
To answer this; we need to know about the interest rate on FD in India, first and the historical pattern of it. RBI annual reports have historical deposit rates offered by scheduled commercial banks in India. The RBI annual reports have the interest rate on deposit for different tenures or years of maturity, like three to five years and five or more years.
History of Interest Rate on Deposits
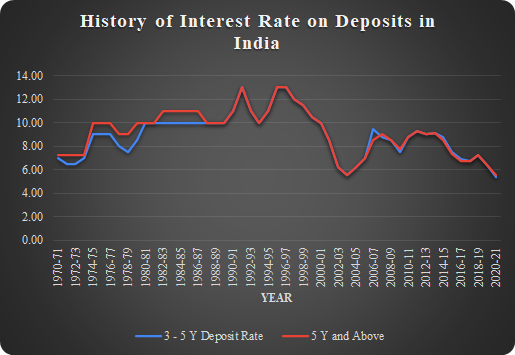
Before the start of this millennium, the principal amount used to double in five to seven years in FD. In India, the interest rates on FD were very high. Chart 1 shows the interest rate on FD for three to five year and five or more years for the last 50 years.
Between the financial year (FY) 1995 and 1997 interest rate on deposit was 13% per annum for deposit maturing in three years and above. For non-risk takers, it was the best time; however, the party did not last. The interest rate on deposit started to decline from FY 1997-98. In FY 2003-04, the interest rate on deposit fell to 5.5%, a fall of staggering -7.5% in interest rate. The interest rate on deposit started to rise again from FY 2004-05 and went up to 9.25% per annum in FY 2011-12; however, it was nowhere close to the peak rate of 13%. For FY 2019-20 the interest rate on deposit for a three to five year period was 6.4% and for five or more years it was 6.4%.
The Impact on Principal Doubling Time
Chart 2 shows the time required for doubling the principal amount. Minimum time required for doubling the principal amount was 5.68 years in the last 5 decades. I have used five years or more interest rate on deposits for calculating doubling time.
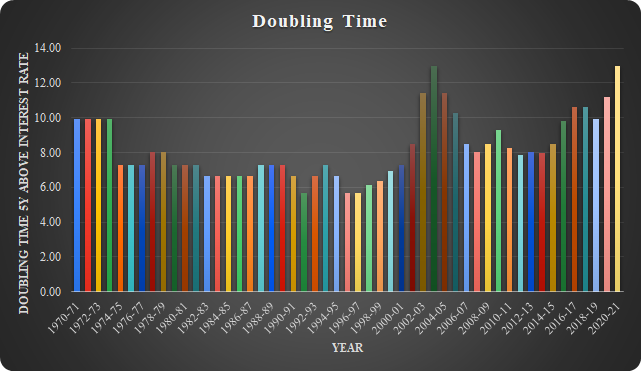
The aforementioned analysis shows the performance of fixed deposits (FD). The maximum interest rate on FD was 13% and the minimum doubling time for the principal was 5.68 years.
In the following section, I will discuss the performance of mutual funds.
Mutual Fund Return
Funds Used For Return Calculation
For this analysis, I wanted to use funds that have large historical fund value data; hence, I have selected only those funds which were launched on or before 31 December 2009. Funds from the following asset classes were selected:
- Equity Funds: Equity funds primarily invest in company shares. Shares give investors a part of ownership in the company.
- Debt Fund, and: Debt Funds invests in government and corporate debts. They buy bond debentures.
- Hybrid Funds: Hybrid funds invest in both equity and debt. Because of the mixing of different asset classes, it is called hybrid.
The data source for this analysis is the AMFI website; the website has historical NAV data from mid-2006.
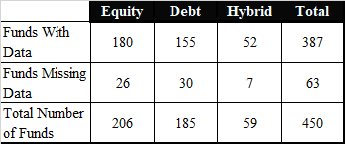
The number of funds meeting the selection criteria is 450; however, all the funds do not have historical data in AMFI nav history. The return is calculated using data until 30 September 2020.
Table 1 provides the number of funds that are missing data.
Return Calculation Method
Normally to do a return comparison, people will select two points in time and calculate the return of a mutual fund and compare it to the interest rate on FD. Here the date selected for return calculation becomes arbitrary and does not give a clear picture. Let me show you an example, that will help you understand how the date selection will change the whole return.
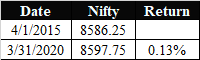
The table 2 below shows the absolute return of Nifty between 1st April 2015 and 31st March 2020. The value is 0.134%; for five years nifty has generated zero returns, and if I added the effect of inflation, the returns will turn negative from zero. A sceptic will simply say investing in the share market does not generate any return looking at this number. But is it the case market generated zero returns in five years. Let’s see another set of numbers. In table 3 I have calculated return on Nifty for the period between 30th September 2015 and 30 September 2020 and absolute return comes at 41.5% for five years or an annualized rate of return of 7.189% per annum. Selecting two different time periods six months apart changes the whole picture. From zero or negative returns (inflation-adjusted) to a healthy return of 7.189% (inflation-adjusted will be positive). So how can we overcome this kind of problem? Yes! Please welcome rolling returns.

The Rolling Returns
The method for calculating a simple return does not require a lot of computational power; one can manually calculate it. A sharp mathematical mind can calculate it in his memory. The formula for a simple return is below:
Simple return = (Pt1250 / Pt1) -1
Annualised Return = (Pt1250 / Pt1)^(1/n) -1
Where
Pt1250 = Value of asset on 1250th ( taking 1 year has 250 business days)
Pt1 = Value of asset on 1st day
N = Number of Years
Whereas calculating rolling return is bit computationally heavy and manually not possible even calculating in excel is also difficult. In rolling return, return for the different time period is calculated and the average of all calculated return is taken, it will be more clear from the formula below:

The median return is the absolute return of five years. To convert it to annualized return we can use below formula:
Annualized return = (1+median return)^ (⅕) -1
The results of the analysis are presented in the next section.
Results
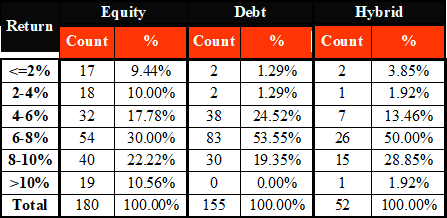
Table 4 shows annual return percentage groups and several funds falling in each group for equity, debt and hybrid class of funds. In the equity asset class, 67% of funds have given returns of less than or equal to 8% annually. In case of debt funds, more than 80% of funds have given returns of less than or equal to 8% annually and for hybrid funds it is just below 70% of funds.
It can be easily said that more than two-thirds of equity and hybrid funds gave less than or equal to 8% return.
Comparison of Mutual Fund Return and Interest Rate on Fixed Deposit
We can compare the latest interest rate on FD with mutual fund returns and say mutual funds generate more returns. As we can see from data from the RBI annual report that for the financial year 2019-20, the interest rate on deposit was 5.5% for a 5 year period; but would it be correct? In my opinion, no, we have removed arbitrary time selection to calculate mutual funds return, we should remove the arbitrary selection of interest rate also.
To overcome the issue of arbitrary selection, I have also calculated the rolling interest rate for five years and taken the median value of it. I have used the interest rate for five years and the time period is from 1990-91 to 2019-20. The median interest comes at 8.64%.
Table 5 below shows a comparison of the median interest rate of FD and mutual fund returns. Approximately 27% equity mutual funds outperform interest rate on FD and Hybrid funds also have a good share of funds outperforming interest rate on FD.

These all funds returns are for regular plans, what about direct plans return. The direct plan started in 2013, hence cannot be included in a formal analysis, however, we can perform a back of hand calculation.
Assuming for equity asset class funds, direct plans will give 0.75% more returns annually. 63 equity funds or 35%, will generate more than the annual interest rate on FD.
Conclusion
Based on the methodology used in this article, it can be concluded that in most cases the interest rate on FD is higher compared to mutual fund returns. Direct plan of equity has given more return than FD for 35% funds. All funds will never give more return than the interest rate on FD. Fund performance analysis and fund selection will be very crucial for generating an extra return.
Hoping bmsmoney.com can solve the problem of performance analysis and selection for investors, currently, our website is not able to do the task properly, but as our tagline goes it is just the “beginning of analysis”.