As of 27 February 2026, the NIFTY SMALLCAP 250 returns are:
- 1 year Return of NIFTY SMALLCAP 250 14.7%
- 3 year Return of NIFTY SMALLCAP 250 21.2%
- 5 year Return of NIFTY SMALLCAP 250 18.2%
- 7 year Return of NIFTY SMALLCAP 250 18.3%
- 10 year Return of NIFTY SMALLCAP 250 16.1%
- 15 year Return of NIFTY SMALLCAP 250 13.2%
- 20 year Return of NIFTY SMALLCAP 250 12.2%
As of 27 February 2026, the Nifty 50 returns are:
- 1 year Return of NIFTY 50 13.8%
- 3 year Return of NIFTY 50 13.3%
- 5 year Return of NIFTY 50 11.6%
- 7 year Return of NIFTY 50 12.9%
- 10 year Return of NIFTY 50 13.7%
- 15 year Return of NIFTY 50 10.9%
- 20 year Return of NIFTY 50 11.1%
- 25 year Return of NIFTY 50 12.4%
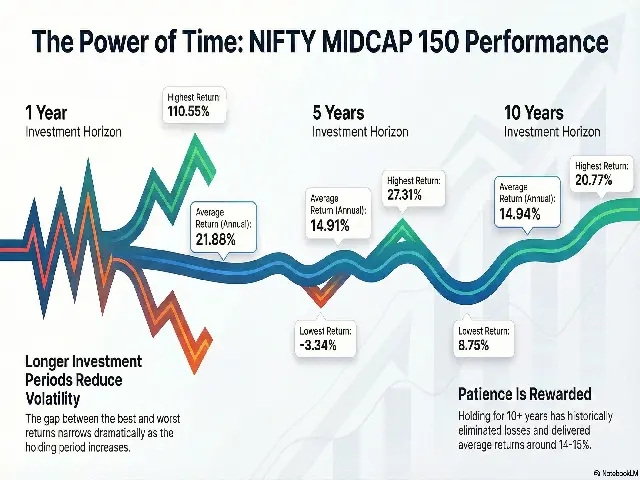
As of 27 February 2026, the NIFTY MIDCAP 150 returns are:
- 1 year Return of NIFTY MIDCAP 150 23.1%
- 3 year Return of NIFTY MIDCAP 150 24.2%
- 5 year Return of NIFTY MIDCAP 150 19.9%
- 7 year Return of NIFTY MIDCAP 150 20.3%
- 10 year Return of NIFTY MIDCAP 150 19.2%
- 15 year Return of NIFTY MIDCAP 150 16.4%
- 20 year Return of NIFTY MIDCAP 150 14.2%