- Goa (₹346,508) and Sikkim (₹334,518) rely heavily on tourism and hydropower—small populations, big rewards.
- Gujarat (₹206,046) & Tamil Nadu (₹189,139) flex industrial muscle—proving growth IS possible with the right policies.
- Bihar (₹33,763) & Uttar Pradesh (₹56,425)—India’s economic graveyards. Decades of central neglect, failed policies, and political apathy keep 25% of India poor. When will the ‘Heartland States’ get real reforms?
India’s Economic Mosaic: Growth, Disparities, and the Road Ahead
India’s economic journey since liberalization has been one of remarkable progress—but also uneven development. The real per capita GSDP data (since 1991) reveals a tapestry of growth, where some states have surged ahead while others continue to face persistent challenges.
From Goa’s high-income resilience (₹346,508) driven by tourism and demographics to Bihar’s uphill struggle (₹33,763) against structural constraints, the disparities are striking. Industrial powerhouses like Gujarat (₹206,046) and Tamil Nadu (₹189,139) showcase the impact of sustained policy focus, while states like Uttar Pradesh (₹56,425) grapple with the complexities of scale and governance.
This analysis goes beyond the numbers, exploring why growth has been lopsided—whether due to geography, policy choices, or historical legacies—and what it means for India’s future. By understanding these patterns, we can ask the right questions about inclusive development, equitable opportunities, and sustainable progress. Let's dive into real per capita GSDP of indian states since 1991
| State | 1991 | 1995 | 2000 | 2005 | 2010 | 2015 | 2020 | 2023 |
|---|---|---|---|---|---|---|---|---|
| Andhra Pradesh | 27252 | 30974 | 38033 | 49414 | 68392 | 88645 | 125830 | 144066 |
| Arunachal Pradesh | 33884 | 39877 | 42718 | 58688 | 75392 | 100088 | 126673 | 120842 |
| Assam | 28965 | 30340 | 30816 | 35388 | 43293 | 50558 | 69746 | 79019 |
| Bihar | 9887 | 12713 | 12784 | 15103 | 20324 | 25379 | 33040 | 33763 |
| Chhattisgarh | 31113 | 33547 | 40676 | 55186 | 68685 | 86897 | 100582 | |
| Goa | 68675 | 79824 | 118515 | 139368 | 178314 | 268338 | 354767 | 346508 |
| Gujarat | 30117 | 38825 | 46717 | 59358 | 90596 | 128068 | 186980 | 206046 |
| Haryana | 43961 | 45985 | 53427 | 70951 | 103196 | 138975 | 190563 | 196782 |
| Himachal Pradesh | 35594 | 40305 | 51032 | 65751 | 92942 | 125720 | 165453 | 178951 |
| Jammu and Kashmir | 37975 | 43106 | 48389 | 59796 | 63353 | 85892 | 95159 | |
| Jharkhand | 26609 | 29991 | 33647 | 40389 | 53347 | 61449 | 67531 | |
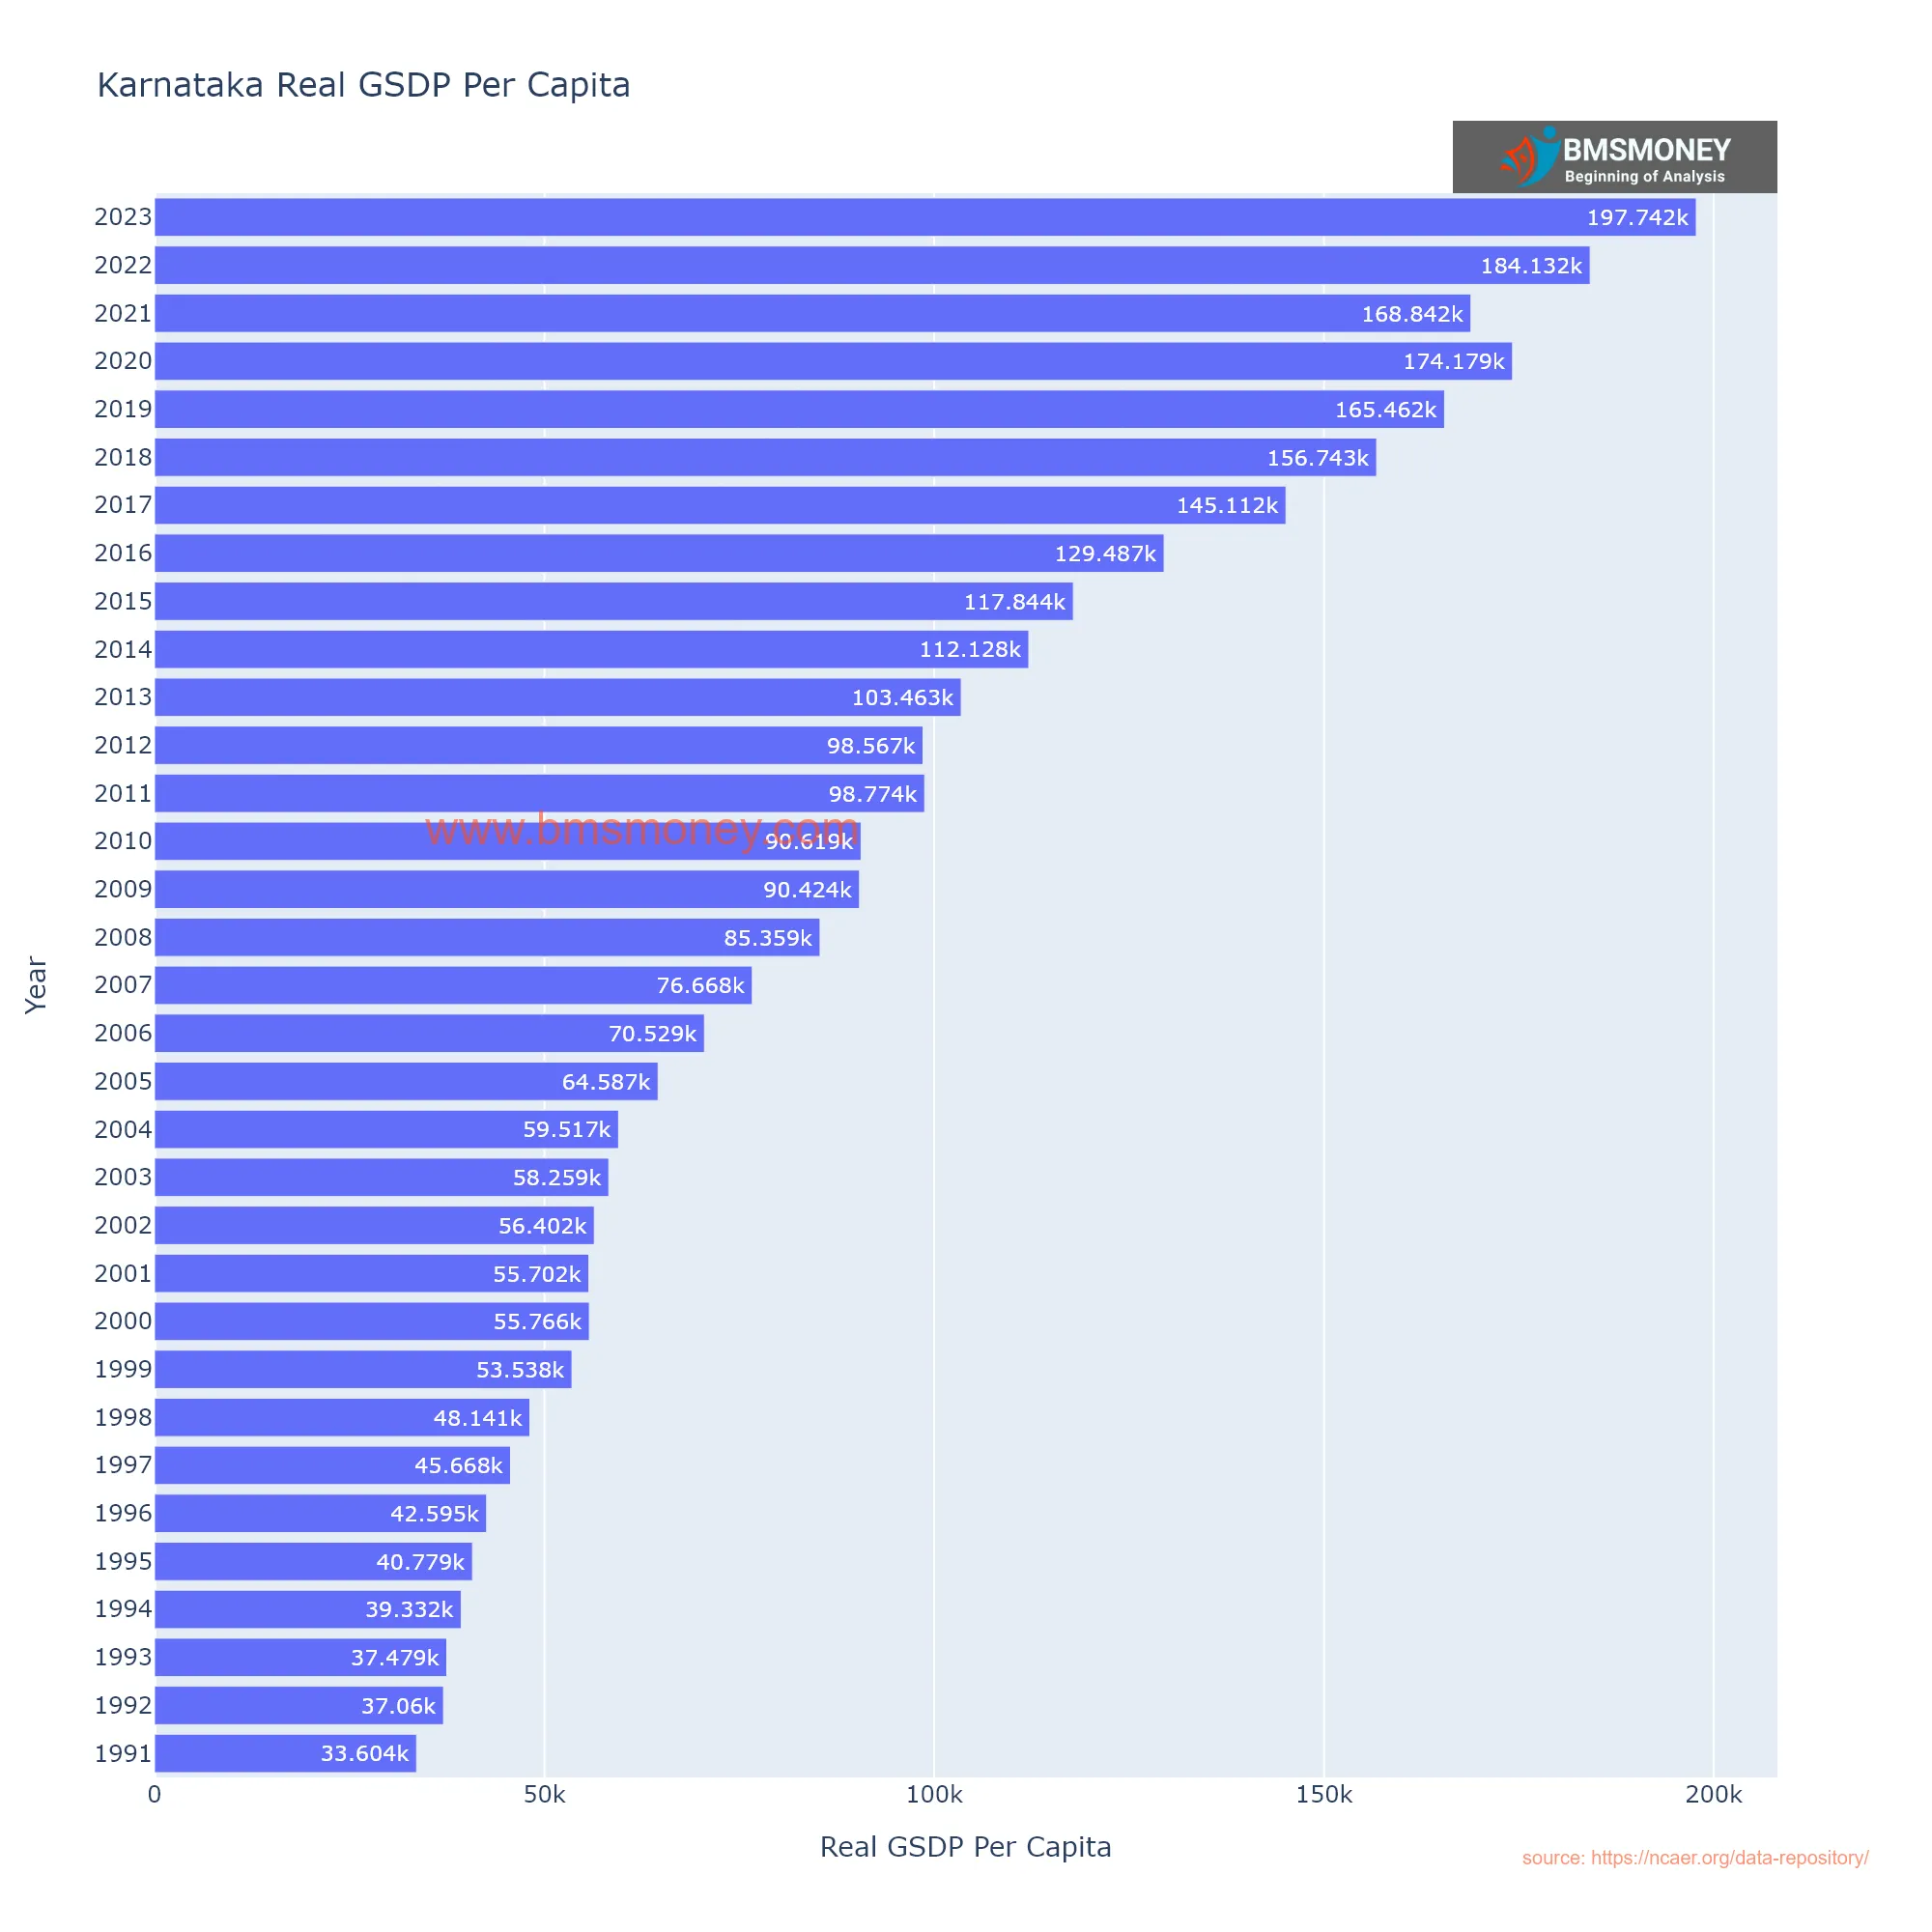
| Karnataka | 33604 | 40779 | 55766 | 64587 | 90619 | 117844 | 174179 | 197742 |
| Kerala | 32837 | 40910 | 50197 | 66710 | 96961 | 123574 | 160506 | 166938 |
| Madhya Pradesh | 15960 | 22730 | 28551 | 28477 | 38746 | 49827 | 68461 | 72306 |
| Maharashtra | 37569 | 44862 | 56890 | 66871 | 99650 | 131977 | 166637 | 177902 |
| Manipur | 25628 | 26524 | 33551 | 36456 | 42774 | 49379 | 55786 | 69354 |
| Meghalaya | 29611 | 29684 | 37254 | 44028 | 56915 | 64698 | 76172 | 79635 |
| Mizoram | 35283 | 41236 | 57559 | 96166 | 149284 | 163611 | ||
| Nagaland | 26660 | 24548 | 39825 | 53210 | 70067 | 85501 | 90257 | |
| Odisha | 21365 | 24855 | 28201 | 35824 | 50008 | 62364 | 87940 | 104082 |
| Punjab | 44051 | 48538 | 56733 | 63102 | 82432 | 107380 | 133231 | 144185 |
| Rajasthan | 27806 | 29590 | 35738 | 39660 | 52903 | 72270 | 87128 | 96983 |
| Sikkim | 41308 | 49224 | 64742 | 154036 | 206492 | 292235 | 334518 | |
| Tamil Nadu | 31536 | 39819 | 49231 | 58973 | 92556 | 120914 | 163874 | 189139 |
| Telangana | 28773 | 32703 | 40155 | 52172 | 80614 | 113238 | 171630 | 191031 |
| Tripura | 15060 | 16212 | 23658 | 33100 | 46573 | 70701 | 94874 | 103580 |
| Uttar Pradesh | 19547 | 21085 | 23355 | 25301 | 32466 | 39548 | 50149 | 56425 |
| Uttarakhand | 35510 | 35892 | 52089 | 98389 | 133722 | 169154 | 171175 | |
| West Bengal | 21071 | 24793 | 32433 | 40023 | 53190 | 60722 | 78324 | 84928 |
Andhra Pradesh: Sustained Growth Through Diversification
Andhra Pradesh has demonstrated consistent economic progress, with its per capita GSDP growing from ₹27,252 in 1991 to ₹144,066 in 2023—a fivefold increase over three decades. This growth has been anchored by the state’s robust agricultural sector, which employs 62% of the workforce and benefits from fertile lands, strong rice production, and thriving horticulture and fisheries.
Beyond agriculture, Andhra Pradesh has strategically diversified its economy. Industrial sectors such as pharmaceuticals, IT, and textiles have gained traction, with Visakhapatnam emerging as a key business and technology hub. The state’s mineral resources—including coal, limestone, and bauxite—have further contributed to its industrial expansion. Policy initiatives, such as the Industrial Single Window Clearance system, have enhanced the business environment, earning the state top rankings in ease of doing business. These efforts are reflected in recent GSDP growth rates of 11.43% (2021-22) and an estimated 17% (2023-24).
Despite this progress, Andhra Pradesh’s per capita income remains below that of smaller, high-income states like Goa (₹346,508) and Sikkim (₹334,518), which benefit from concentrated economic activities and smaller populations. However, when compared to larger states with structural challenges, such as Bihar (₹33,763), Andhra Pradesh’s balanced approach to agriculture, industry, and policy reform stands out.
Moving forward, sustaining this growth will require addressing rural-urban disparities, enhancing skill development, and further strengthening infrastructure to ensure more inclusive and equitable development. The state’s trajectory offers valuable insights into how diversified economies can achieve long-term progress.

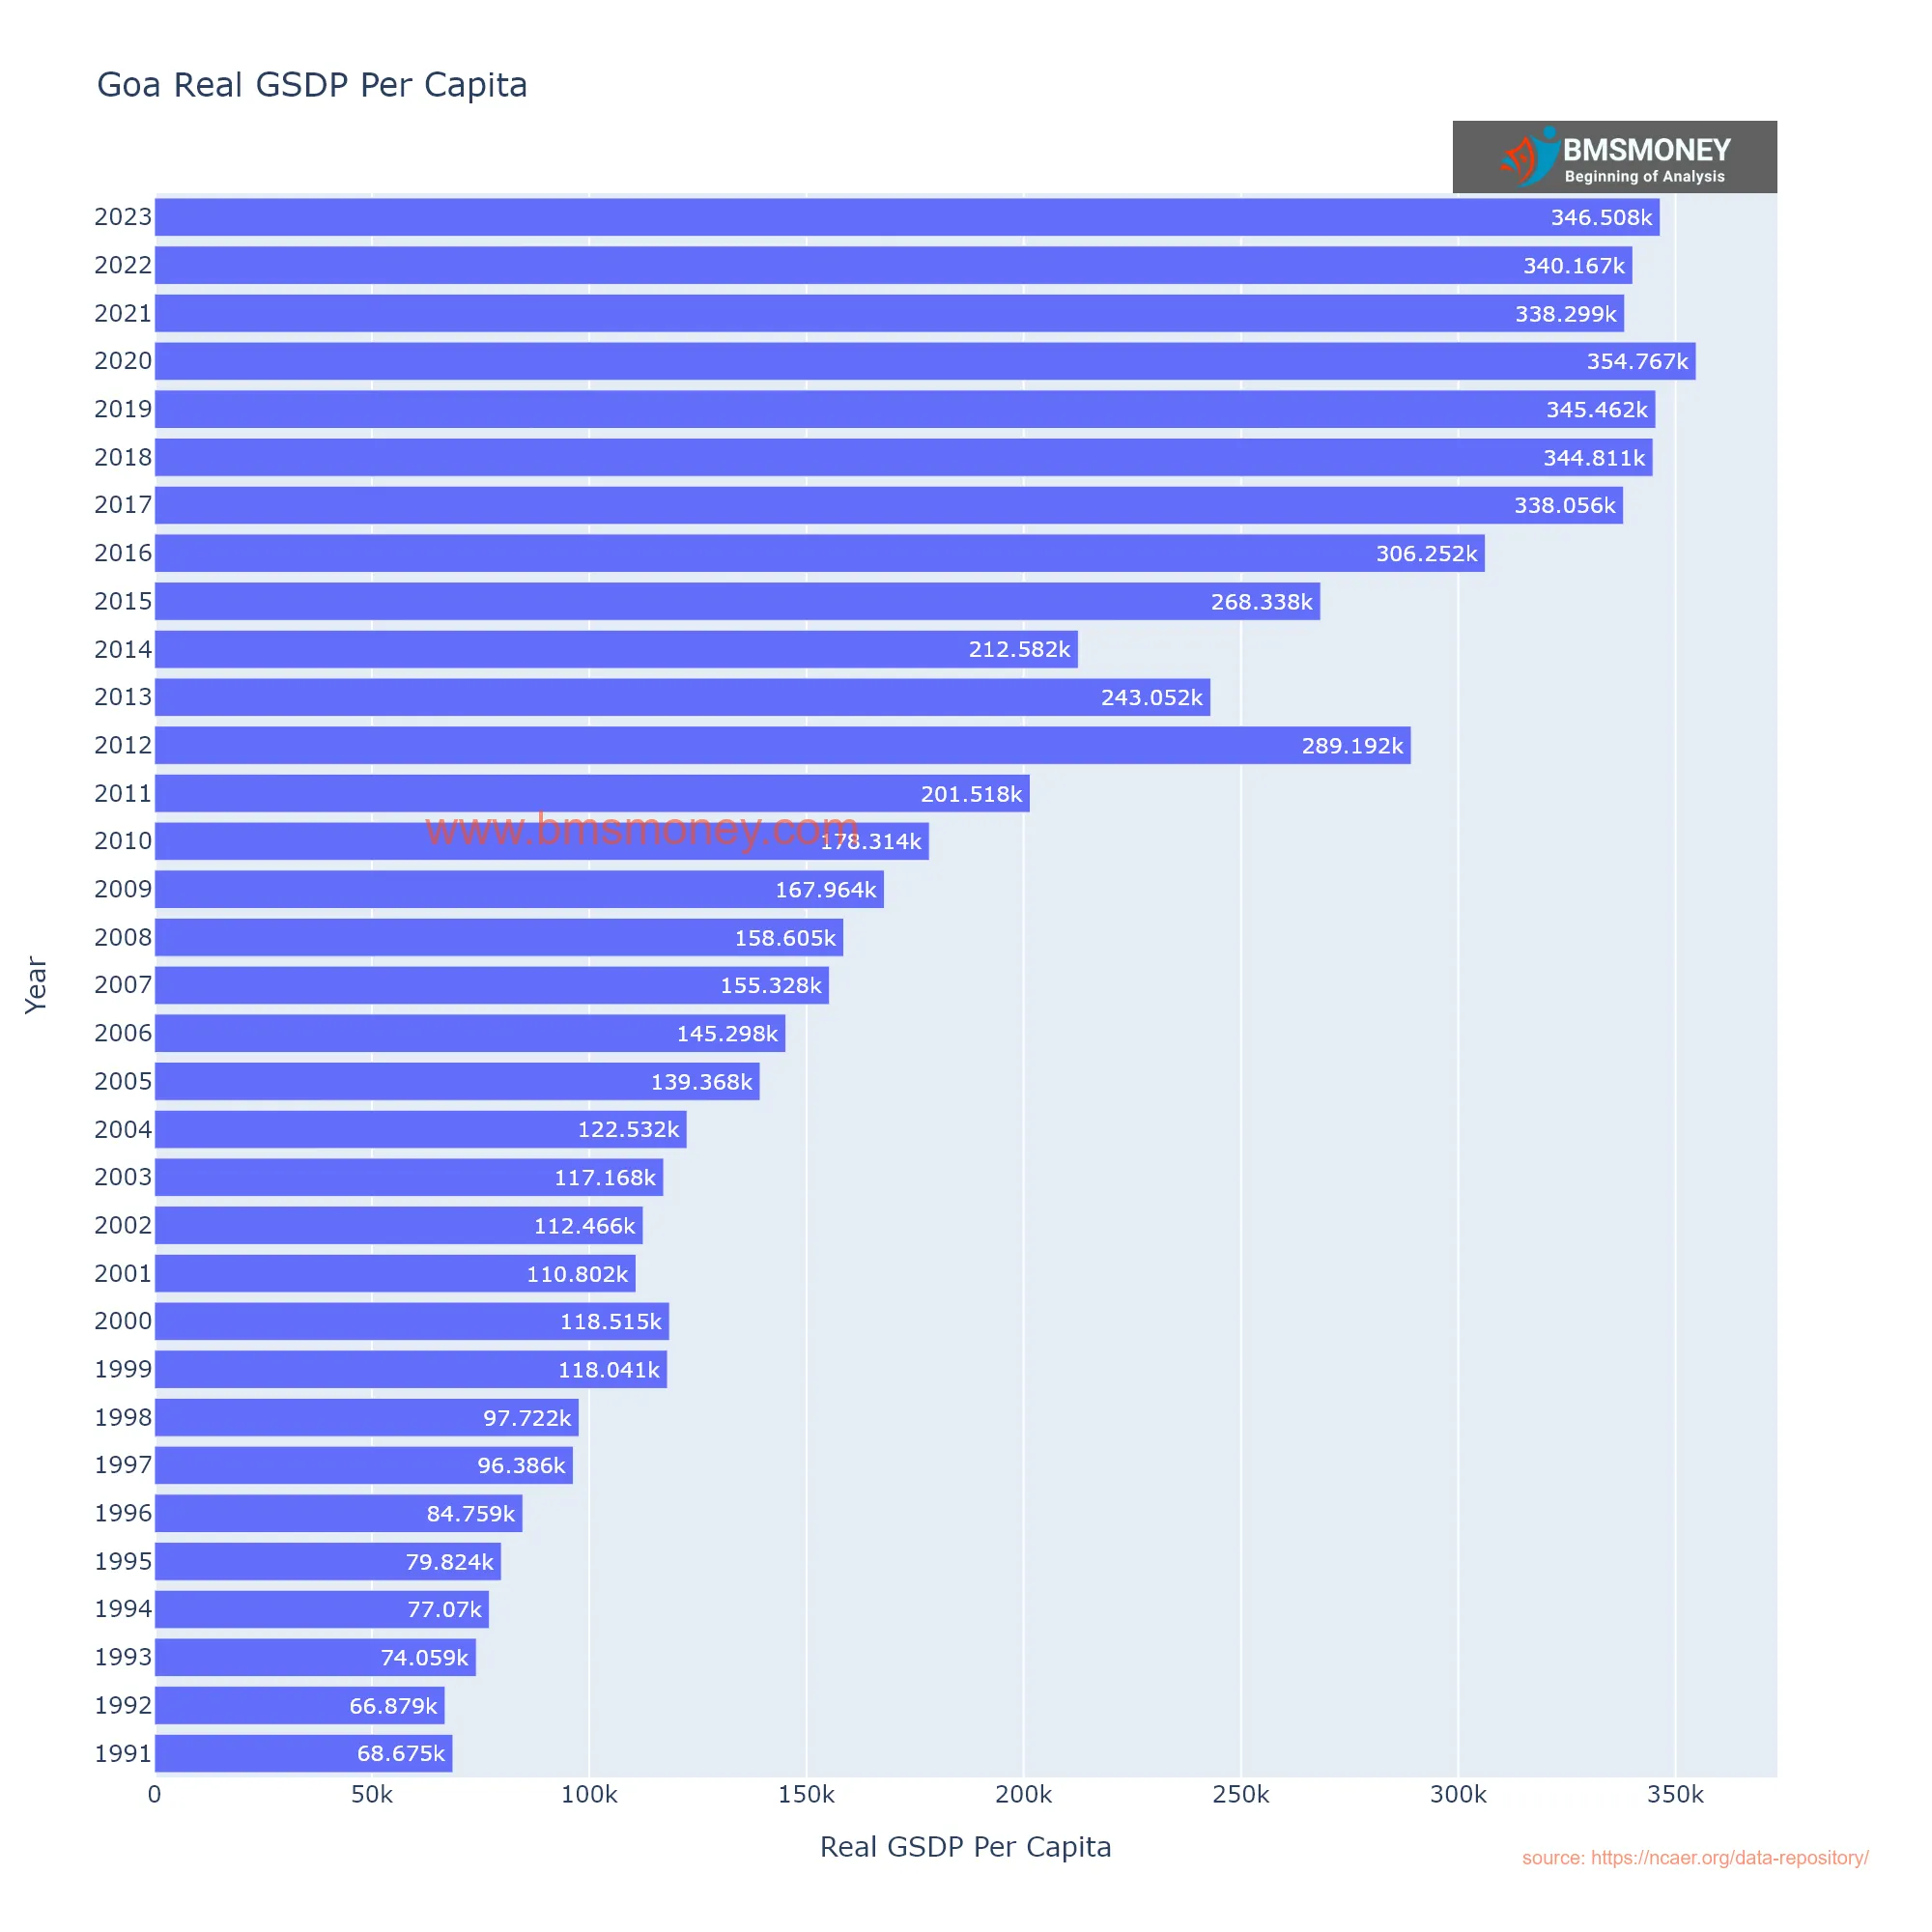
Goa: A Case Study in Focused Economic Development
With a per capita GSDP of ₹346,508 in 2023 - the highest among Indian states - Goa has demonstrated remarkable economic progress since 1991, when its per capita income stood at ₹68,675. This exceptional performance stems from three key factors: sectoral specialization, demographic advantages, and strategic infrastructure development.
Tourism serves as the primary economic driver, contributing significantly to state revenues through its world-class beaches, UNESCO-listed heritage sites, and thriving hospitality sector. The state's compact population of 1.5 million allows for more effective distribution of economic benefits compared to larger states like Uttar Pradesh (₹56,425). Secondary sectors including mining (particularly iron ore) and pharmaceuticals provide additional economic stability.
Goa's development model presents interesting contrasts when examined against other states:
• Its per capita income more than doubles that of Andhra Pradesh (₹144,066), demonstrating the advantages of economic specialization
• The gap becomes even more pronounced when compared to primarily agrarian states like Bihar (₹33,763)
• Even resource-rich states like Jharkhand (₹67,531) struggle to match Goa's performance without similar diversification
Looking ahead, Goa faces the challenge of maintaining its economic edge while addressing potential vulnerabilities. The state's heavy reliance on tourism makes it particularly sensitive to global travel trends and environmental pressures. Future growth may require:
-
Further diversification into knowledge-based industries
-
Sustainable tourism practices to preserve natural assets
-
Enhanced connectivity infrastructure to support economic expansion
This analysis suggests that while focused development strategies can yield impressive results, long-term resilience requires balancing specialization with economic adaptability. Goa's experience offers valuable lessons for other states seeking to optimize their growth trajectories.
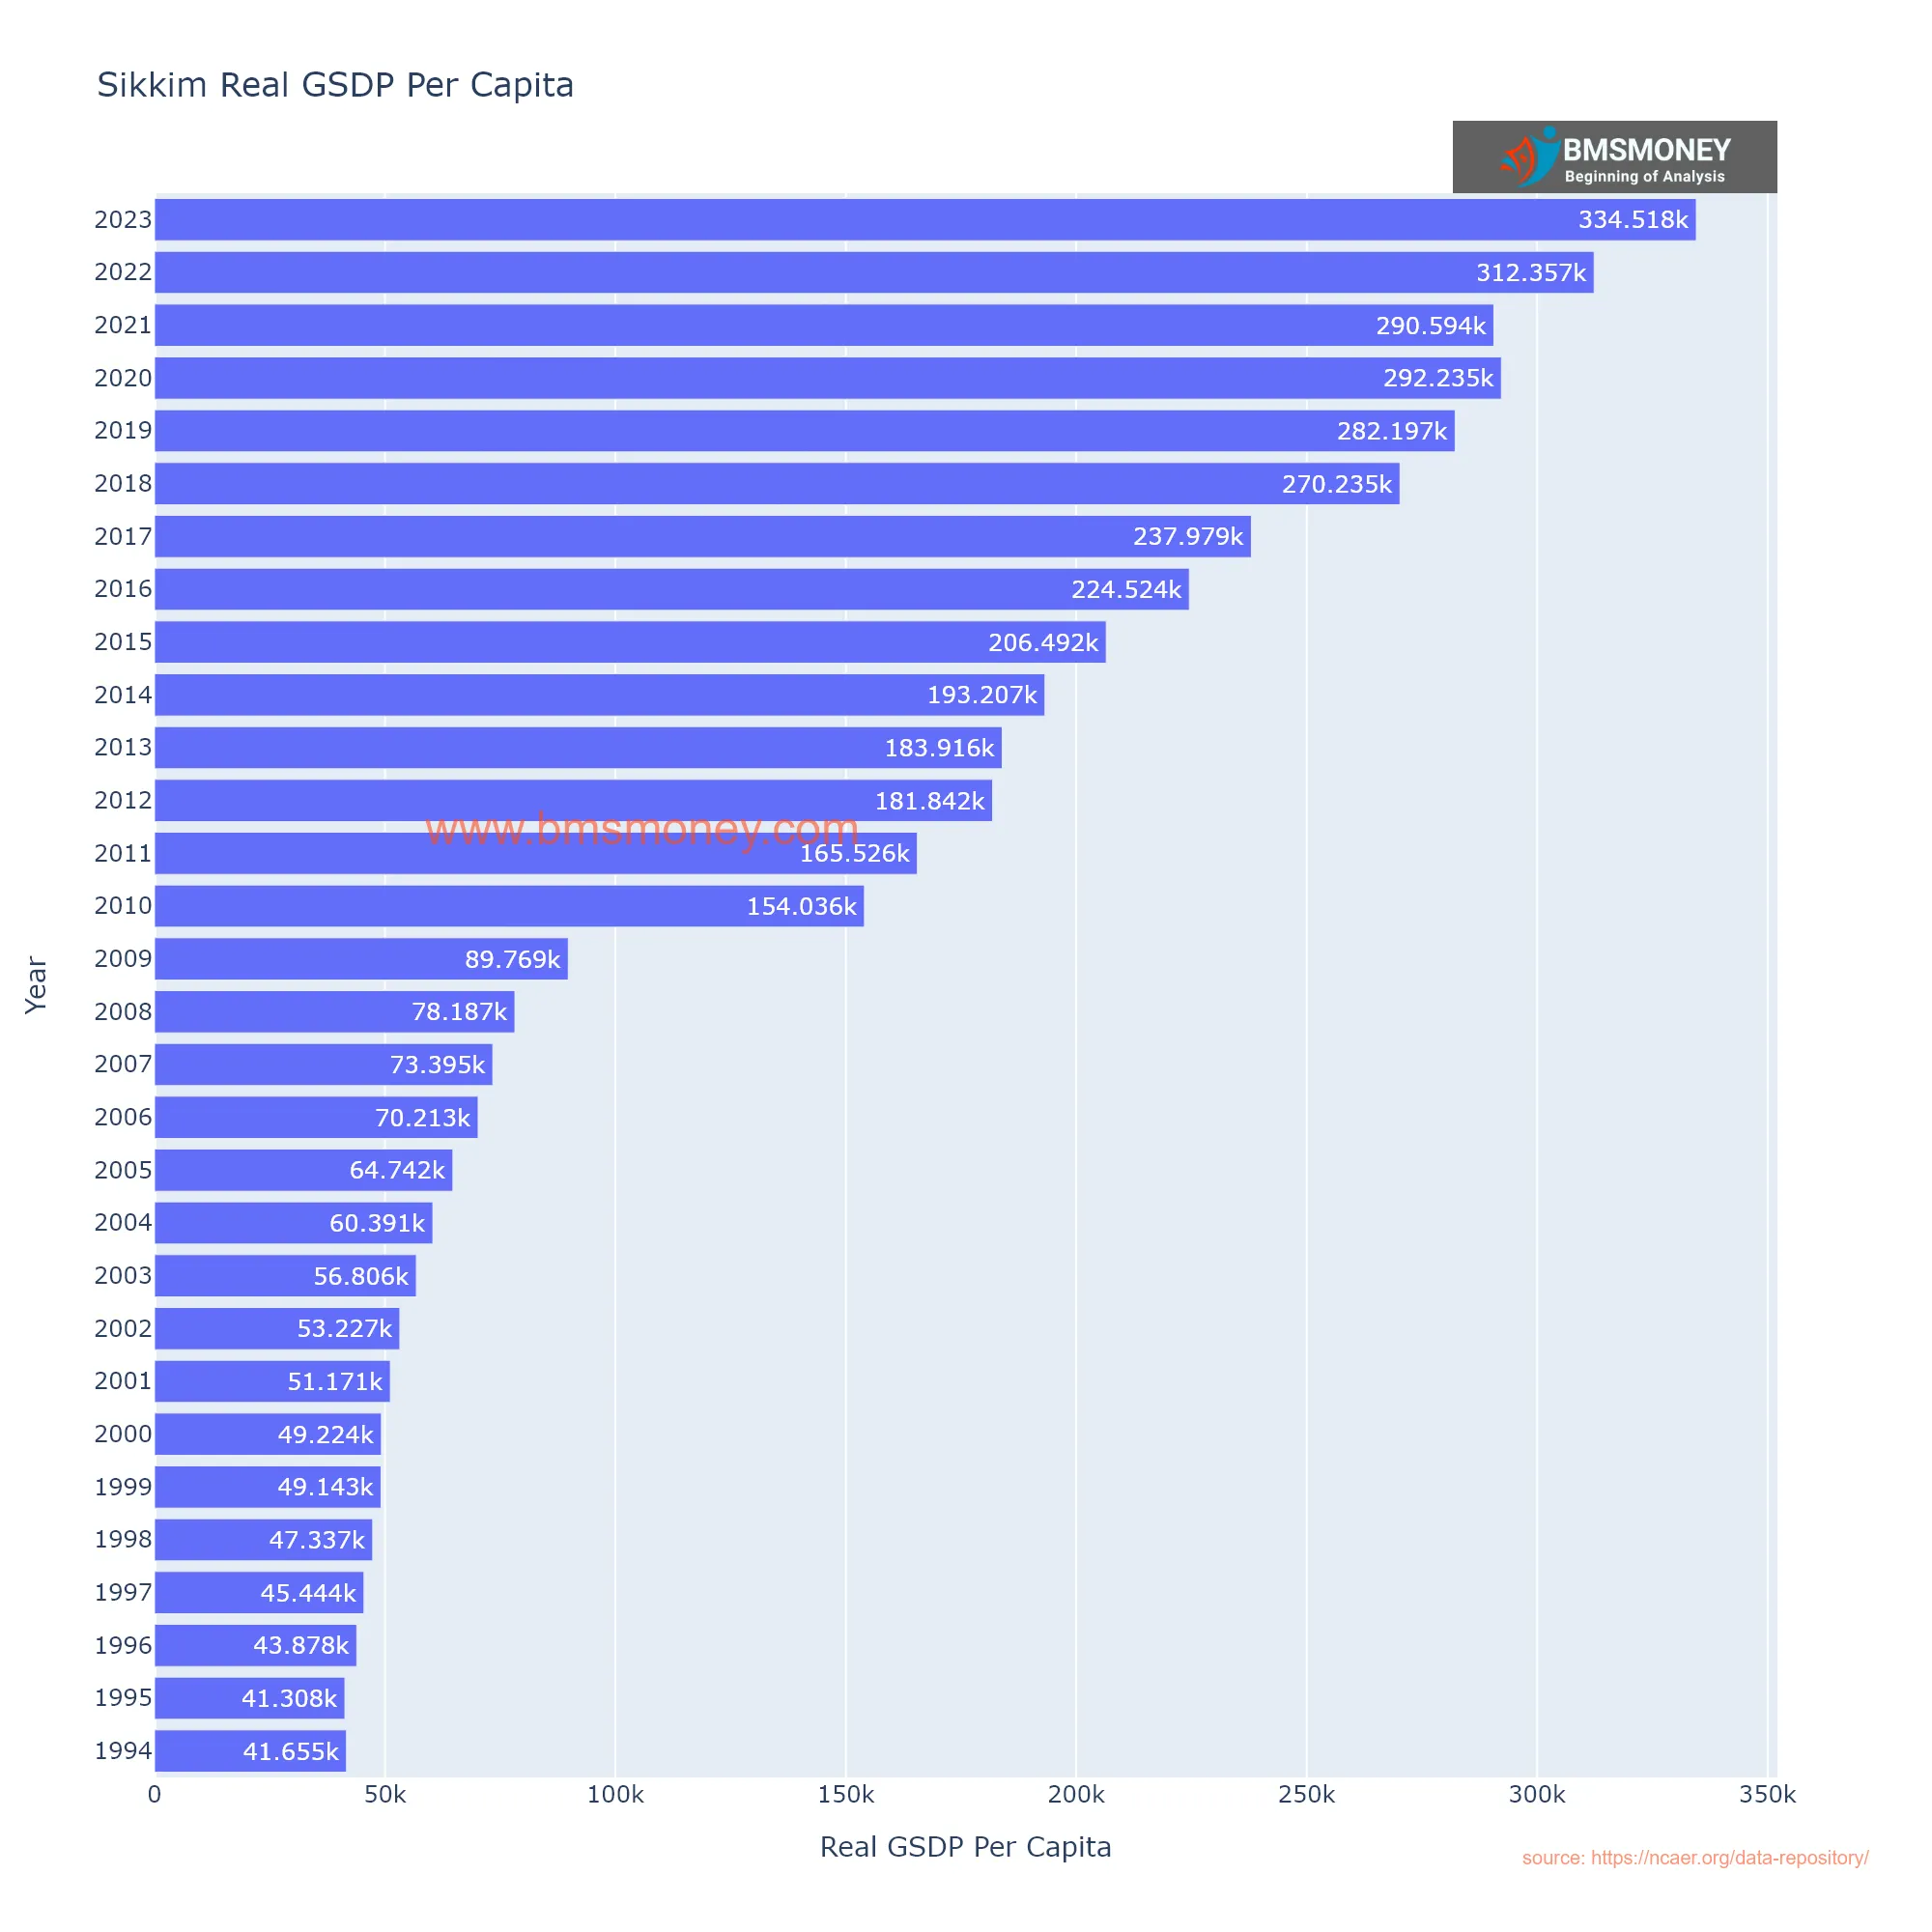
Sikkim: Harnessing Natural Advantages for Sustainable Growth
Sikkim has emerged as one of India's highest-performing states economically, with its per capita GSDP reaching ₹334,518 in 2023 - a significant increase from ₹41,308 in 1995. This remarkable achievement stems from the state's strategic utilization of its unique geographical assets and focused policy interventions.
Key Growth Drivers:
-
Renewable Energy Leadership: The state's mountainous terrain and abundant rivers have enabled it to become a pioneer in hydroelectric power generation
-
Eco-Tourism Development: Sikkim's pristine Himalayan landscapes and biodiversity have been carefully developed into a sustainable tourism model
-
Demographic Advantages: With a population of just 0.6 million, economic benefits are distributed more effectively than in larger states
Comparative Perspective:
-
Sikkim's per capita GSDP more than doubles that of Andhra Pradesh (₹144,066)
-
Significantly outperforms larger states like Madhya Pradesh (₹72,306) and Rajasthan (₹96,983)
-
Demonstrates how geographical constraints can be transformed into economic opportunities
Future Considerations:
While Sikkim's current model has proven successful, maintaining this growth trajectory will require:
• Diversification beyond primary sectors to ensure long-term stability
• Continued investment in sustainable infrastructure development
• Balancing tourism growth with environmental conservation efforts
Sikkim's experience offers valuable insights for other states, particularly in demonstrating how targeted development of natural advantages can overcome size limitations. The state's challenge now lies in building on this foundation while preserving the ecological assets that underpin its success.
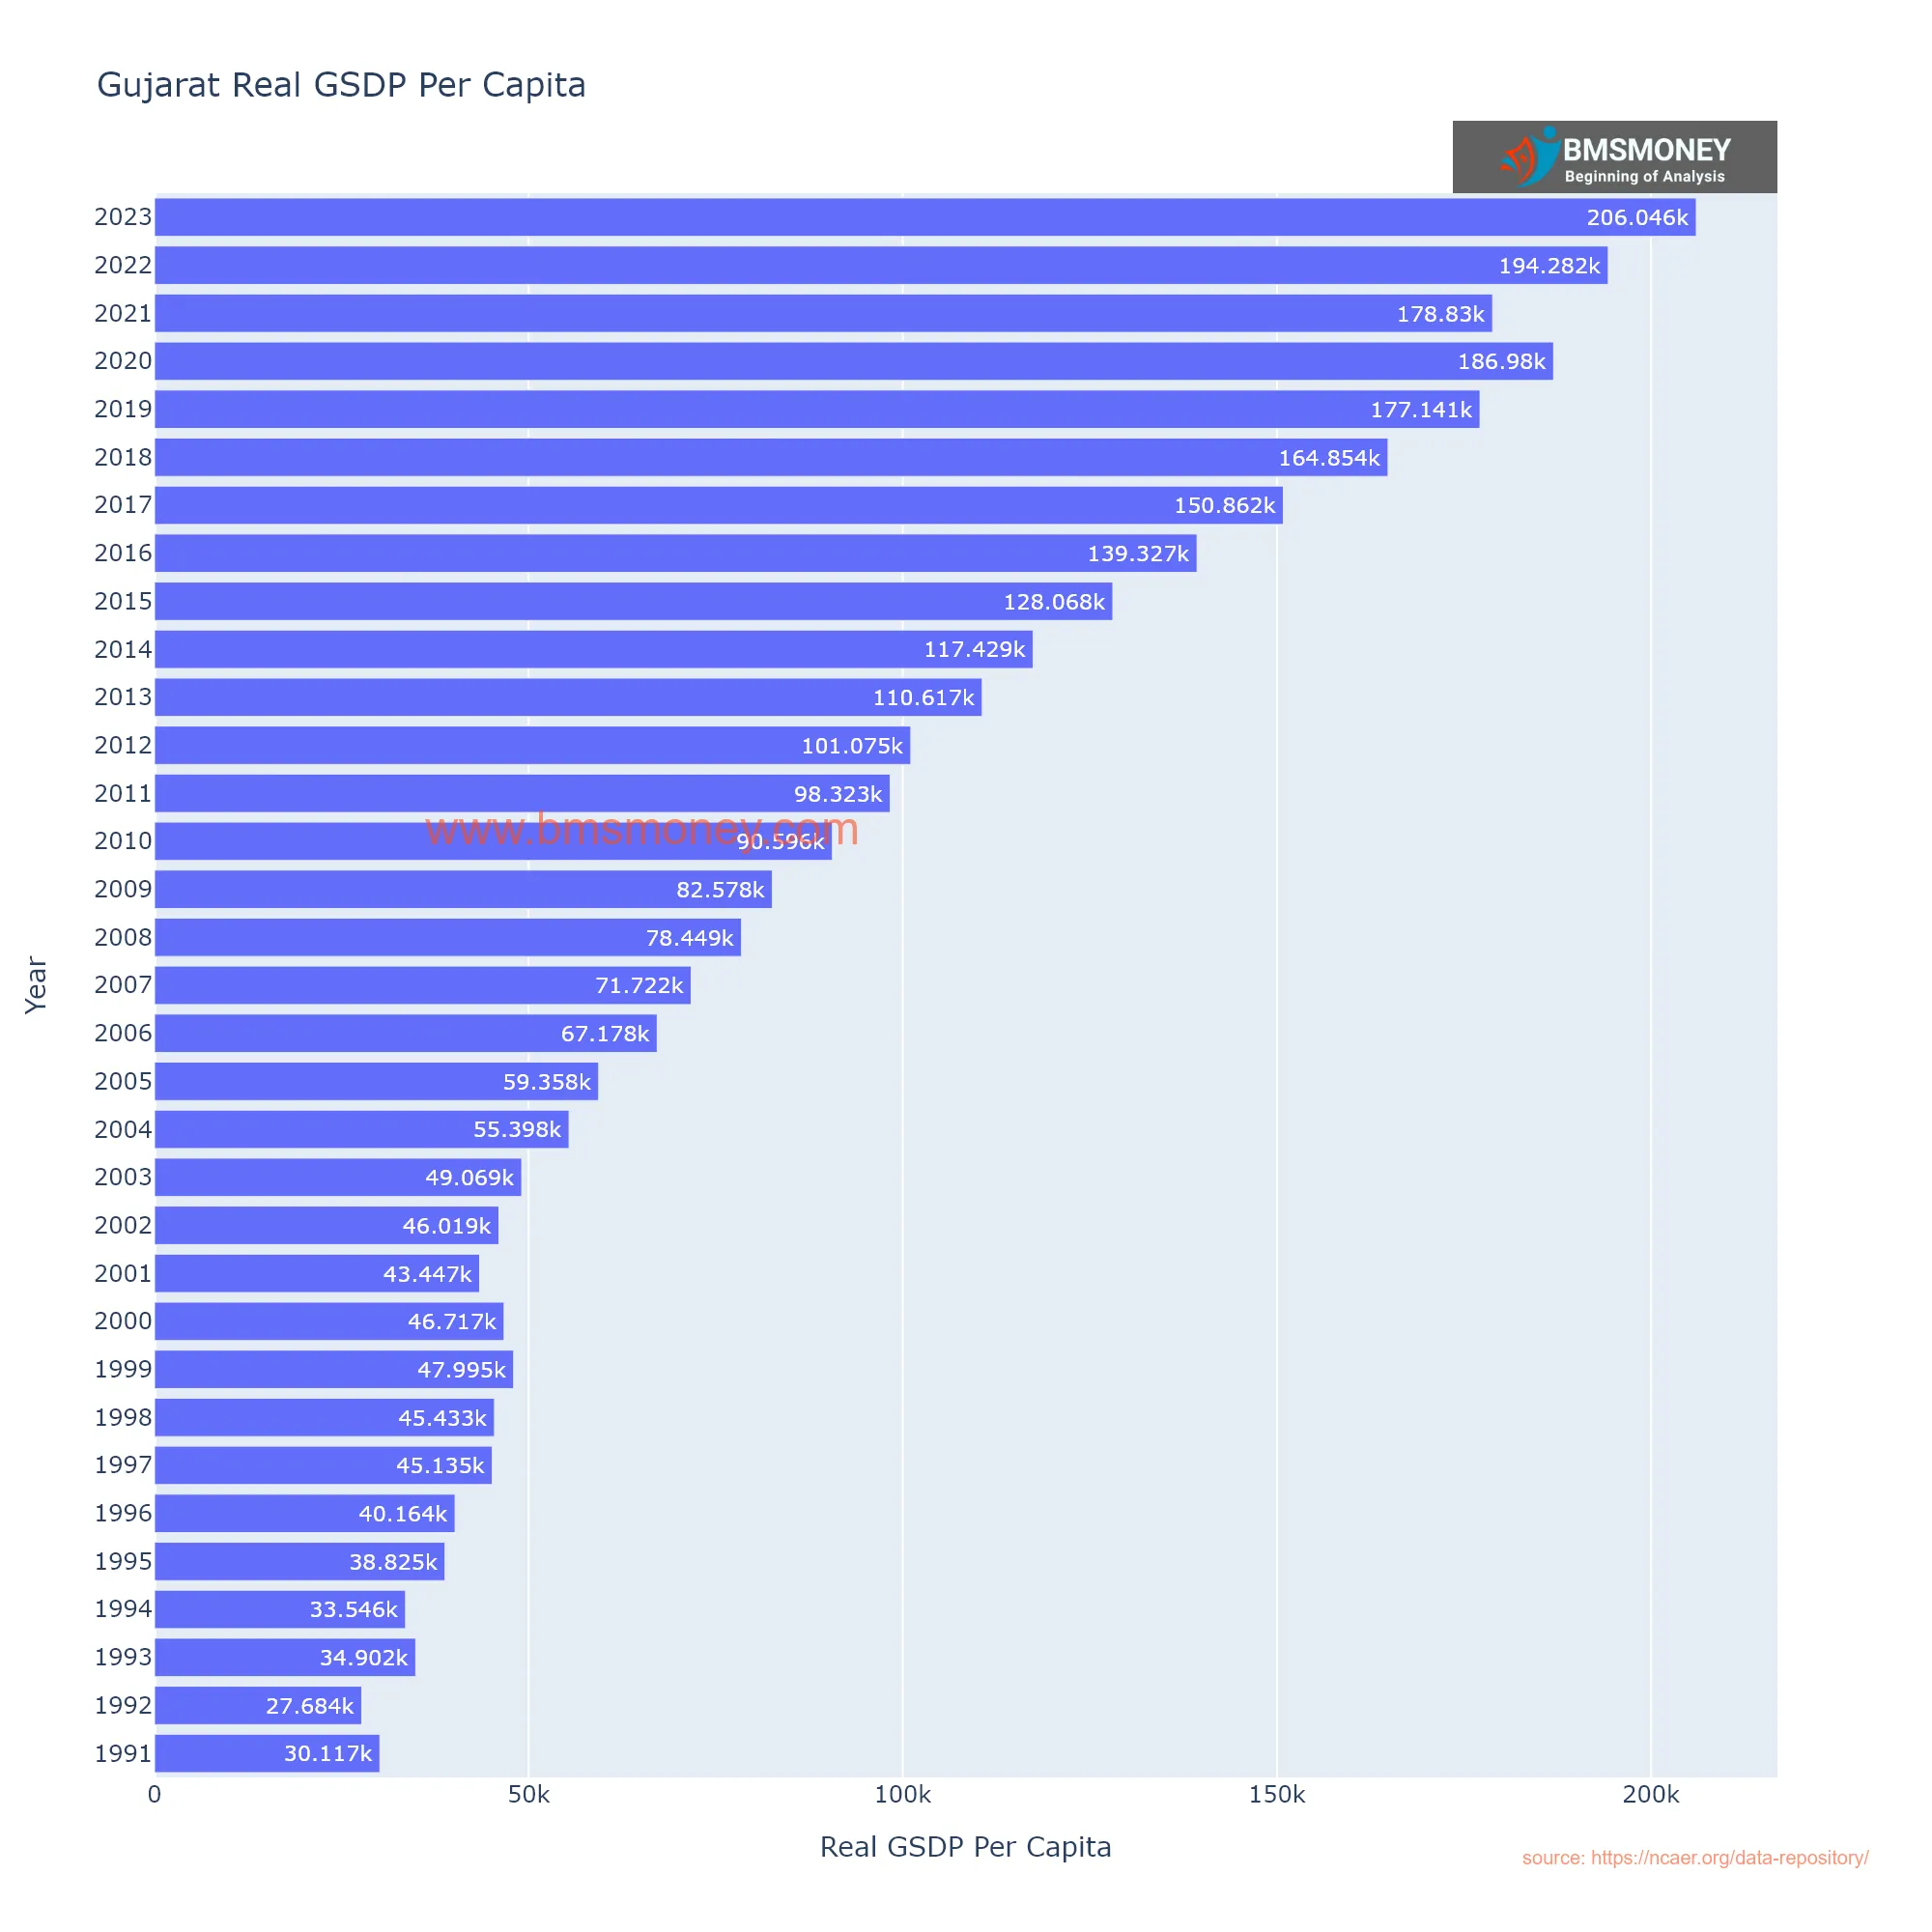
Gujarat: India's Industrial Powerhouse
With a per capita GSDP of ₹206,046 in 2023 - up from ₹30,117 in 1991 - Gujarat has cemented its position as one of India's most economically advanced states. This sevenfold growth over three decades underscores the success of its industry-led development model.
Economic Foundations:
-
Industrial Leadership: Home to 33% of India's chemical production and the world's largest refining complex at Jamnagar
-
Trade Infrastructure: 1,600 km coastline with 42 ports handling 40% of India's cargo
-
Policy Framework: Vibrant Gujarat Summit has attracted ₹45 lakh crore in investment commitments since 2003
-
Agricultural Backbone: Despite industrial focus, contributes 18% to GSDP with strong cotton and groundnut production
Comparative Advantage:
-
Outperforms diversified economies like Andhra Pradesh (₹144,066) through concentrated industrial development
-
Leads resource-rich peers like Odisha (₹104,082) by adding manufacturing value to raw materials
-
Demonstrates how port access can transform regional economies
Development Challenges:
• Addressing growing urban-rural divide (Saurashtra vs. Ahmedabad-Surat corridor)
• Managing environmental impacts of heavy industrialization
• Transitioning to higher value-added manufacturing
Lessons for Other States:
Gujarat's success highlights:
-
The multiplier effects of infrastructure investment
-
The importance of consistent policy frameworks
-
The need to balance industrial growth with inclusive development
The state now faces the challenge of moving up the value chain while ensuring more equitable regional growth - a transition that will determine whether it can maintain its economic leadership position.
Karnataka: A Balanced Model of Tech-Led Growth
With its per capita GSDP reaching ₹197,742 in 2023 - a sixfold increase from ₹33,604 in 1991 - Karnataka has emerged as a blueprint for balanced economic development in India. The state's success stems from its unique combination of technological leadership and agricultural strength.
Growth Engines:
-
Technology Powerhouse: Bengaluru accounts for 38% of India's IT exports, generating $85 billion in software revenues annually
-
Diversified Economy: While IT dominates (25% of GSDP), agriculture (15%) remains robust with global leadership in coffee and silk production
-
Policy Ecosystem: SEZ policies and startup incentives have created Asia's second-largest technology cluster
-
Manufacturing Base: Aerospace, biotech and electronics manufacturing contribute 20% to state output
Comparative Performance:
-
Maintains 37% higher per capita income than Andhra Pradesh (₹144,066) through knowledge economy focus
-
Nearly triples the output of resource-rich but infrastructure-limited states like Manipur (₹69,354)
-
Demonstrates how urban innovation can elevate entire regional economies
Development Challenges:
• Managing Bengaluru's infrastructure strain (traffic, water scarcity)
• Bridging growing urban-rural disparities
• Maintaining competitiveness in global tech markets
• Diversifying beyond Bengaluru-centric growth
Strategic Opportunities:
-
Expanding tech hubs to tier-2 cities (Mysuru, Mangaluru)
-
Leveraging agri-tech to modernize rural economy
-
Developing aerospace and defense manufacturing corridors
Karnataka's model demonstrates how states can harness knowledge industries while maintaining agricultural foundations. Its future success will depend on addressing regional imbalances and creating more distributed growth centers across the state - challenges that will test the sustainability of its development approach. The state's experience offers valuable lessons in managing the transition from traditional to knowledge-based economies.
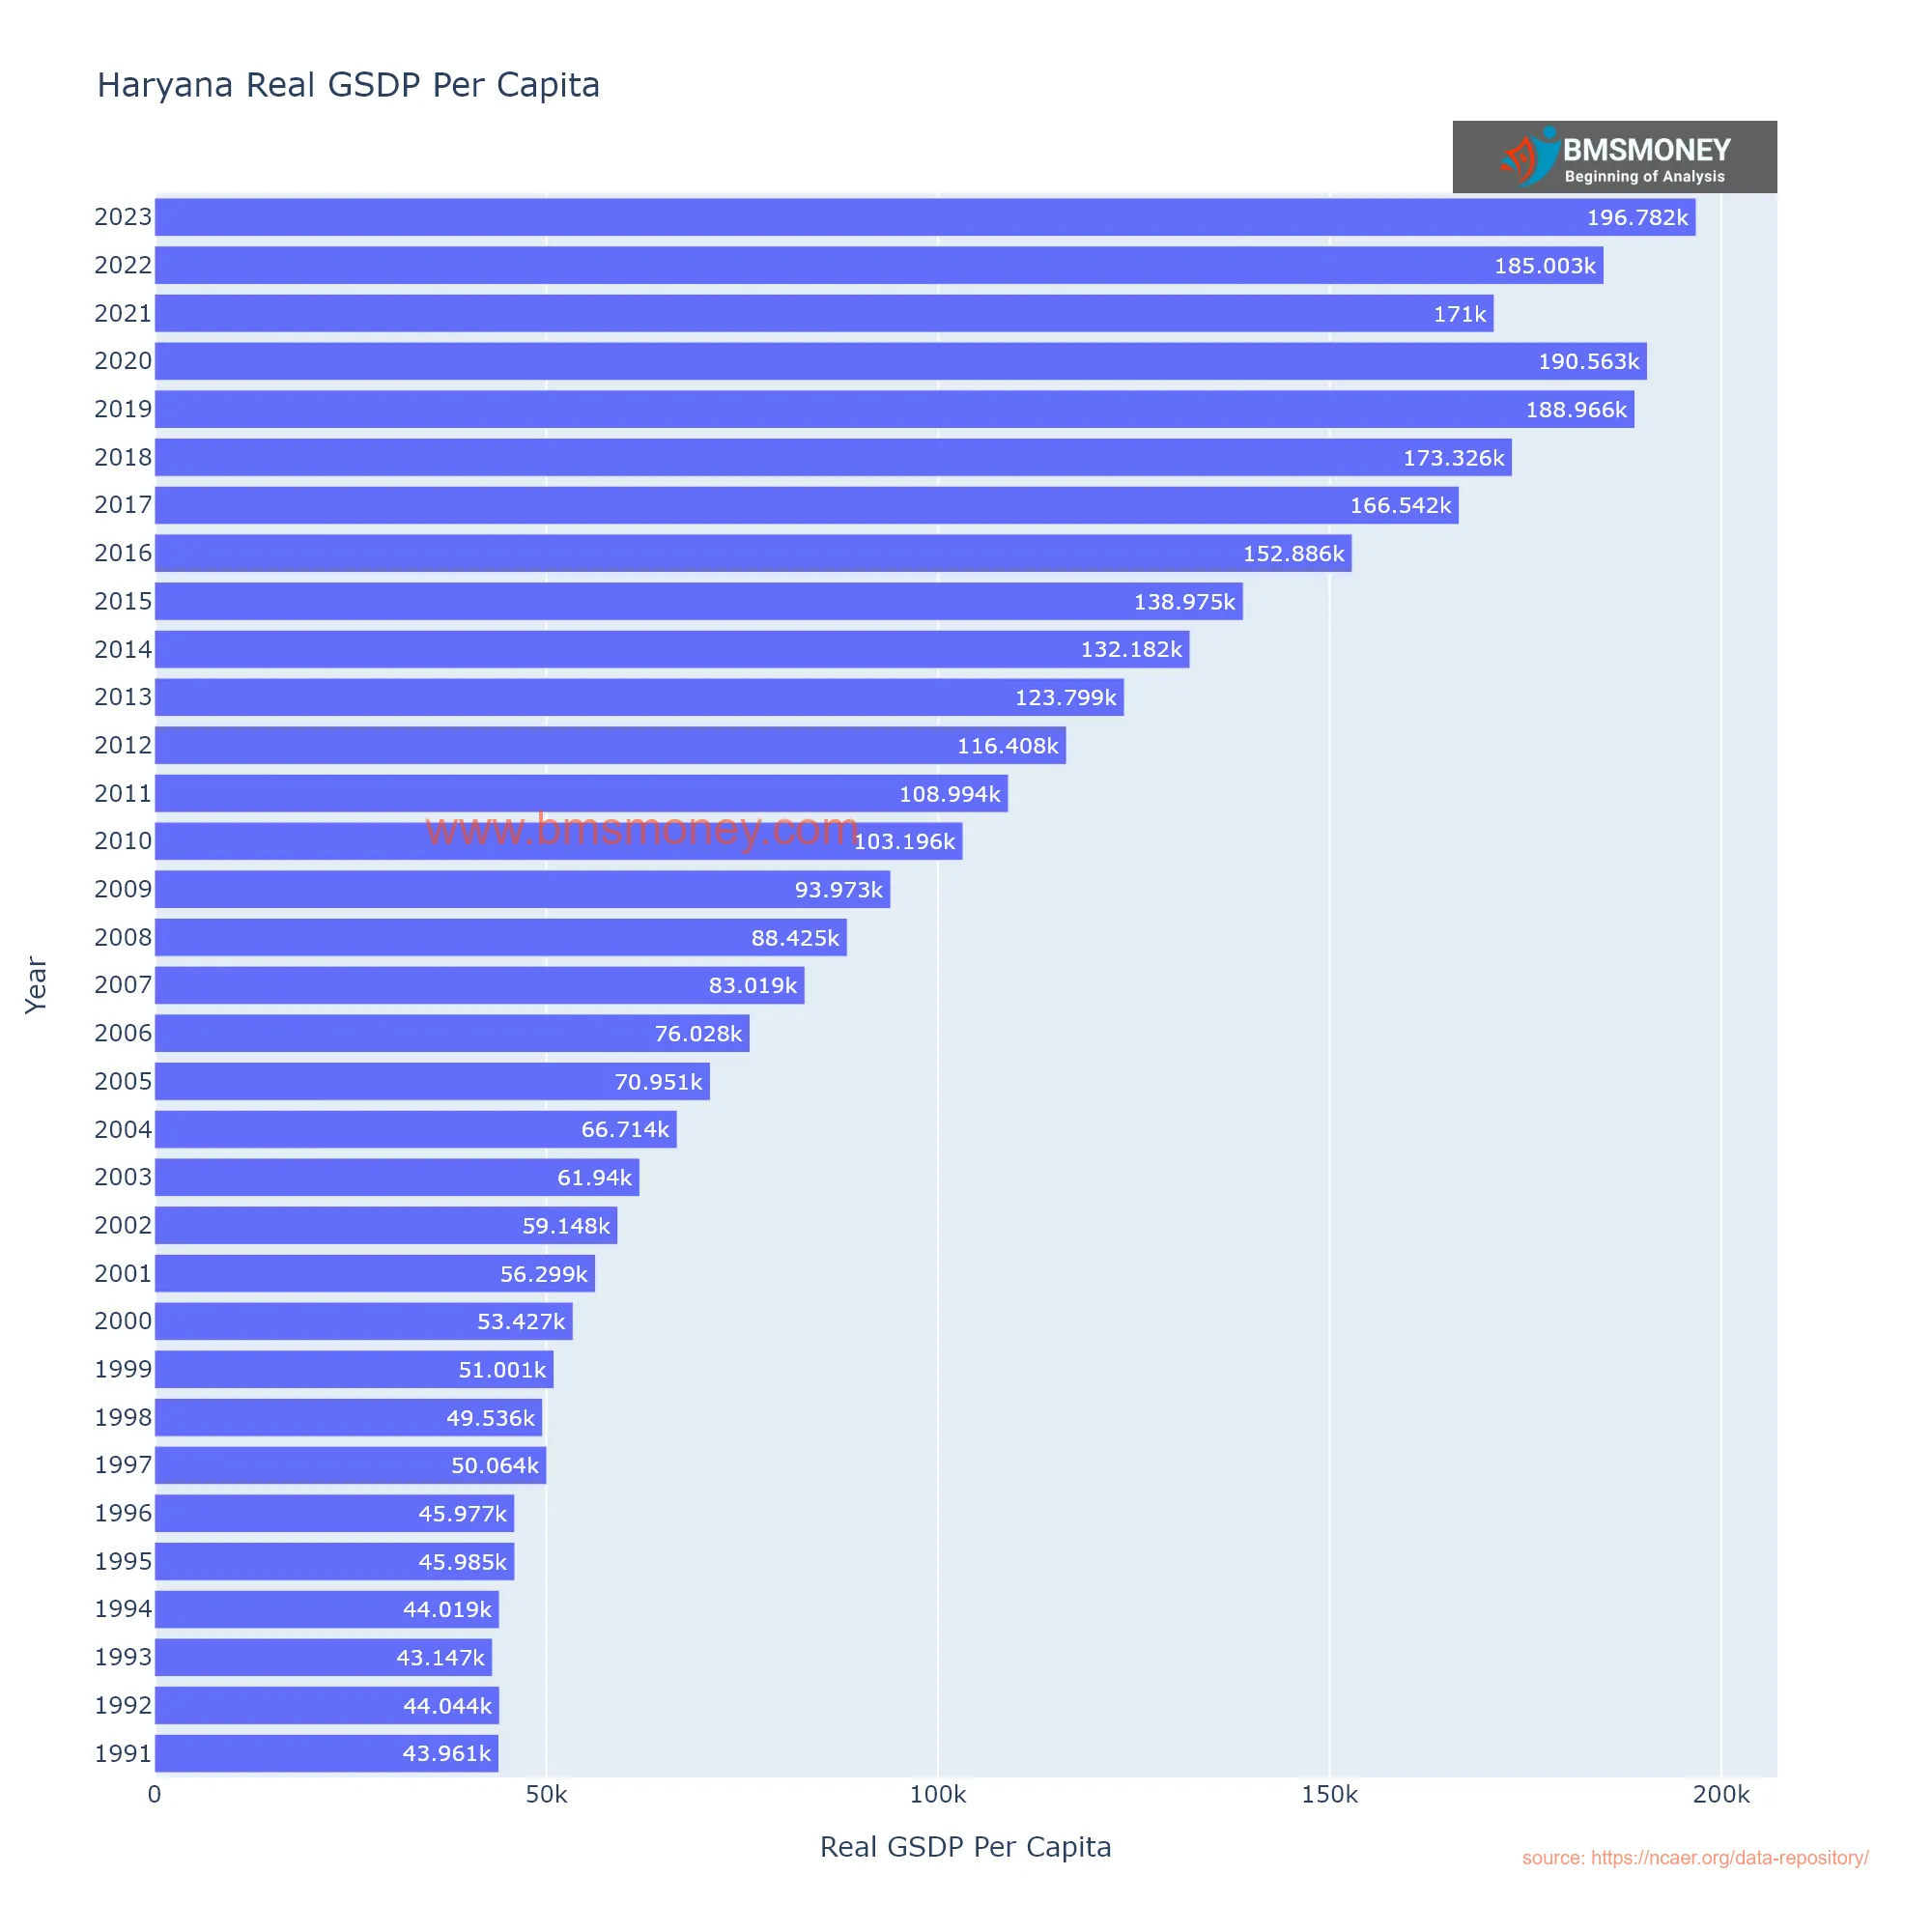
Haryana: Strategic Advantage Meets Economic Transformation
With a per capita GSDP of ₹196,782 in 2023 - a 4.5-fold increase from ₹43,961 in 1991 - Haryana has emerged as northern India's economic powerhouse. The state's success demonstrates how geographic advantage, when coupled with sound policy, can drive sustained growth.
Key Economic Pillars:
-
Industrial Prowess:
-
Contributes 35% to India's passenger vehicle production
-
Gurugram hosts 50% of Fortune 500 companies' Indian headquarters
-
Developing as a major IT/ITeS hub with 1.4 million sq. ft. of Grade A office space
-
-
Agricultural Strength:
-
Second largest contributor to India's wheat and basmati rice supplies
-
60% of workforce engaged in agriculture despite only 18% GSDP contribution
-
-
Infrastructure Advantage:
-
70% of NCR's industrial area falls within Haryana
-
6 operational industrial corridors including Kundli-Manesar-Palwal Expressway
-
Comparative Edge:
-
Outperforms Andhra Pradesh (₹144,066) by 36% through urban-industrial concentration
-
Nearly triples the output of Madhya Pradesh (₹72,306), demonstrating the NCR proximity dividend
-
Maintains 25% higher per capita income than Punjab despite similar agrarian base
Development Challenges:
• Addressing stark rural-urban disparities (Gurugram vs. southern districts)
• Managing NCR's environmental stress (air quality, water scarcity)
• Transitioning from jobless growth to employment-intensive sectors
• Diversifying beyond automotive sector dominance
Policy Lessons:
-
The multiplier effect of infrastructure-led development
-
Importance of leveraging geographic advantages
-
Need for balanced regional development strategies
Haryana's next phase of growth will require addressing its contradictions - between its gleaming corporate hubs and agrarian heartland, between its economic success and environmental costs. The state's ability to create more inclusive growth while maintaining its competitive edge will determine whether it can sustain its position among India's leading economies. Its experience offers crucial insights into managing the urban-rural divide in rapidly developing regions.