As of 27 February 2026, the NIFTY MIDCAP 150 returns are:
- 1 year Return of NIFTY MIDCAP 150 23.1%
- 3 year Return of NIFTY MIDCAP 150 24.2%
- 5 year Return of NIFTY MIDCAP 150 19.9%
- 7 year Return of NIFTY MIDCAP 150 20.3%
- 10 year Return of NIFTY MIDCAP 150 19.2%
- 15 year Return of NIFTY MIDCAP 150 16.4%
- 20 year Return of NIFTY MIDCAP 150 14.2%
Introduction
We’re diving into the performance of the NIFTY MIDCAP 150 Index from 2006 to 2025. This dataset covers yearly returns (1-year) and longer-term growth rates (3-year, 5-year, 7-year, 10-year, and 15-year CAGRs). Our aim is to spot trends and understand what they mean for investors in India’s midcap space. We’ll look at averages, highs, and lows, and how often returns were positive or negative.
| Date | 1Y Return | 3Y CAGR | 5Y CAGR | 7Y CAGR | 10Y CAGR | 15Y CAGR | 20Y CAGR |
| 2026-02-27 | 23.08 | 24.17 | 19.9 | 20.3 | 19.22 | 16.38 | 14.15 |
| 2025-02-28 | -0.45 | 18.67 | 23.11 | 14.65 | 14.99 | 14.82 | |
| 2024-02-29 | 56.26 | 26.46 | 24.37 | 18.58 | 21.67 | 21.52 | |
| 2023-02-28 | 7.44 | 22.05 | 10.85 | 17.16 | 16.81 | 10.83 | |
| 2022-02-28 | 20.47 | 21.02 | 14.46 | 13.45 | 16.43 | 12.94 | |
| 2021-02-26 | 40.47 | 8.95 | 18.54 | 19.68 | 14.65 | 12.29 | |
| 2020-02-28 | 4.72 | 5.09 | 7.4 | 14.63 | 10.88 | ||
| 2019-02-28 | -12.09 | 16.74 | 19.04 | 14.52 | 20.13 | ||
| 2018-02-28 | 26.08 | 15.79 | 23.08 | 17.19 | 10.82 | ||
| 2017-02-28 | 43.56 | 29.2 | 18.44 | 13.46 | 12.19 | ||
| 2016-02-29 | -14.22 | 15.99 | 10.9 | 21.6 | 9.29 | ||
| 2015-02-28 | 75.13 | 23.69 | 14.48 | 8.75 | |||
| 2014-02-28 | 3.87 | 3.74 | 21.22 | 5.61 | |||
| 2013-02-28 | 4.04 | 2.62 | -0.22 | 6.55 | |||
| 2012-02-29 | 3.31 | 34.3 | 6.27 | ||||
| 2011-02-28 | 0.55 | -2.73 | 7.72 | ||||
| 2010-02-26 | 133.17 | 9.28 | |||||
| 2009-02-27 | -60.75 | -14.8 | |||||
| 2008-02-29 | 42.6 | ||||||
| 2007-02-28 | 10.52 | ||||||
| 2006-02-28 | |||||||
| count | 20 | 18 | 16 | 14 | 11 | 6 | 1 |
| mean | 20.39 | 14.46 | 14.97 | 14.72 | 15.19 | 14.8 | 14.15 |
| std | 39.39 | 12.4 | 7.19 | 4.95 | 4.11 | 3.83 | |
| min | -60.75 | -14.8 | -0.22 | 5.61 | 9.29 | 10.83 | 14.15 |
| max | 133.17 | 34.3 | 24.37 | 21.6 | 21.67 | 21.52 | 14.15 |
| median | 8.98 | 16.36 | 16.46 | 14.64 | 14.99 | 13.88 | 14.15 |
| Positive Return Year Count | 16 | 16 | 15 | 14 | 11 | 6 | |
| Negative Return Year Count | 4 | 2 | 1 | 0 | 0 | 0 |
Key Findings
- The NIFTY MIDCAP 150 has delivered an average 1-year return of 20.4% — approximately 300 bps higher than NIFTY 50’s 17.4% — with significantly higher volatility (Std Dev: 39.4% vs 35.3%).
- Negative 1-year occurrences are fewer in absolute count (4 out of 20 years) vs NIFTY 50 (9 out of 35), though the dataset is shorter; the worst single-year drawdown was −60.8% (2009) vs −47.1% for NIFTY 50.
- Across all measured horizons (7-year to 20-year), the MIDCAP 150 has delivered zero negative return periods, matching NIFTY 50’s record but at consistently higher absolute CAGRs.
- The average 10-year CAGR of 15.2% vs NIFTY 50’s 11.3% represents a significant alpha of ~390 bps over a decade.
- At 15 years, the MIDCAP 150 averages 14.8% CAGR with a minimum of 10.8% — both well above the corresponding NIFTY 50 figures (11.8% avg, 4.9% min).
- The only available 20-year CAGR (2026) stands at 14.2%, comfortably ahead of NIFTY 50’s 11.1% for the same period.
Investment Implications
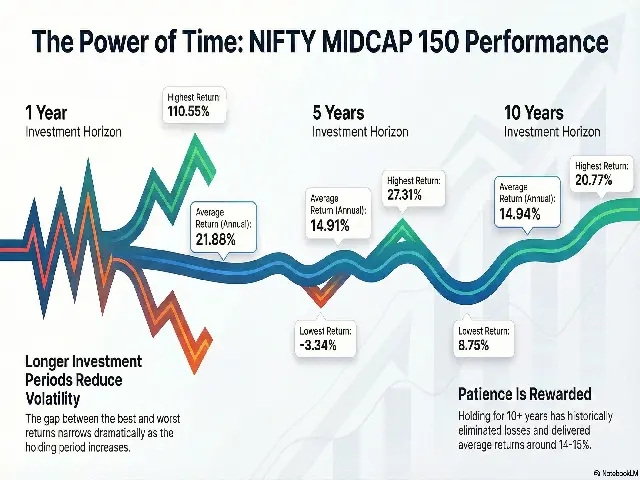
- Mid-cap investing requires a longer commitment horizon to ride out volatility — ideally 7+ years where no negative rolling returns have been recorded.
- The persistent return premium over NIFTY 50 across all longer horizons validates the structural case for mid-cap allocation in a diversified equity portfolio.
- Investors should be prepared for extreme short-term swings; the 2009 drawdown of −60.8% underscores the need for behavioural discipline and SIP-based investing.
📖 RECOMMENDED READS
Statistical Summary — NIFTY MIDCAP 150
The table below summarises key statistical metrics for NIFTY MIDCAP 150 across all rolling return horizons. CAGR figures are used for periods above 1 year.
|
Horizon |
Avg CAGR |
Min |
Max |
Median |
Std Dev |
+ve Years |
-ve Years |
|
1-Year |
20.4% |
-60.8% |
+133.2% |
9.0% |
39.4% |
16/20 |
4/20 |
|
3-Year |
14.5% |
-14.8% |
+34.3% |
16.4% |
12.4% |
16/18 |
2/18 |
|
5-Year |
15.0% |
-0.2% |
+24.4% |
16.5% |
7.2% |
15/16 |
1/16 |
|
7-Year |
14.7% |
+5.6% |
+21.6% |
14.6% |
5.0% |
14/14 |
0/14 |
|
10-Year |
15.2% |
+9.3% |
+21.7% |
15.0% |
4.1% |
11/11 |
0/11 |
|
15-Year |
14.8% |
+10.8% |
+21.5% |
13.9% |
3.8% |
6/6 |
0/6 |
|
20-Year |
14.2% |
+14.2% |
+14.2% |
14.2% |
— |
1/1 |
0/1 |
Note: Dataset starts from Feb 2007 (index launch 2005; sufficient history from 2006). Observation count grows with shorter horizons.
NIFTY MIDCAP 150 vs NIFTY 50 — Head-to-Head Comparison
The comparison below places the two indices side by side across equivalent horizons. NIFTY 50 data spans 35 years (1991–2026); NIFTY MIDCAP 150 data spans 20 years (2006–2026). The alpha generated by mid-caps is consistent across all long-term horizons, though it comes with greater short-term risk.
|
Horizon |
N50 Avg |
MC150 Avg |
N50 Min |
MC150 Min |
N50 Max |
MC150 Max |
N50 -ve |
MC150 -ve |
|
1-Year |
17.4% |
20.4% |
-47.1% |
-60.8% |
+134.1% |
+133.2% |
9/35 |
4/20 |
|
3-Year |
12.2% |
14.5% |
-13.7% |
-14.8% |
+52.6% |
+34.3% |
4/33 |
2/18 |
|
5-Year |
11.2% |
15.0% |
-6.2% |
-0.2% |
+37.5% |
+24.4% |
1/31 |
1/16 |
|
7-Year |
11.2% |
14.7% |
+0.0% |
+5.6% |
+24.5% |
+21.6% |
0/29 |
0/14 |
|
10-Year |
11.3% |
15.2% |
+2.5% |
+9.3% |
+18.3% |
+21.7% |
0/26 |
0/11 |
|
15-Year |
11.8% |
14.8% |
+4.9% |
+10.8% |
+16.5% |
+21.5% |
0/21 |
0/6 |
|
20-Year |
11.8% |
14.2% |
+8.0% |
+14.2% |
+15.0% |
+14.2% |
0/16 |
0/1 |
Interpretation
- Return Premium: MIDCAP 150 outperforms NIFTY 50 by 300–390 bps across all horizons from 5 years to 15 years — a structurally consistent alpha.
- Downside Risk: The worst 1-year and 3-year drawdowns are deeper for MIDCAP 150, reflecting higher sensitivity to market dislocations and liquidity events.
- Floor Returns: The minimum 7-year CAGR of MIDCAP 150 (+5.6%) is much higher than NIFTY 50’s (+0.0%), and the minimum 10-year CAGR (+9.3%) also exceeds NIFTY 50’s (+2.5%). This is a key finding — mid-caps carry less tail risk over long horizons than commonly perceived.
- Volatility Compression: Standard deviation drops from 39.4% at 1-year to 5.0% at 7-year and 4.1% at 10-year for MIDCAP 150, mirroring the same risk-compression effect seen in NIFTY 50.
- For reference on NIFTY 50’s full history, see the BMS Money article: bmsmoney.com/article/full/decades-of-nifty-50-performance-a-comprehensive-analysis-of-returns-from-1991-to-2024/
Recent 5-Year Rolling Returns (2022–2026)
The table below shows NIFTY MIDCAP 150 rolling returns across all horizons for the five most recent data points, providing a current-market perspective.
|
Year |
1Y |
3Y |
5Y |
7Y |
10Y |
15Y |
20Y |
|
2026 |
+23.1% |
+24.2% |
+19.9% |
+20.3% |
+19.2% |
+16.4% |
+14.2% |
|
2025 |
-0.5% |
+18.7% |
+23.1% |
+14.7% |
+15.0% |
+14.8% |
— |
|
2024 |
+56.3% |
+26.5% |
+24.4% |
+18.6% |
+21.7% |
+21.5% |
— |
|
2023 |
+7.4% |
+22.1% |
+10.8% |
+17.2% |
+16.8% |
+10.8% |
— |
|
2022 |
+20.5% |
+21.0% |
+14.5% |
+13.5% |
+16.4% |
+12.9% |
— |
- 2026 (YTD Feb): Exceptional 1Y return of +23.1% with 10Y CAGR at 19.2% — both well above long-run averages, reflecting strong mid-cap momentum.
- 2025: The only negative 1Y year in recent history (-0.5%), yet 3Y CAGR held firm at 18.7%, demonstrating multi-year resilience.
- 2024: Standout year with +56.3% 1Y return — the highest in recent memory, driven by the post-COVID mid-cap re-rating cycle.
- 2022–2023: Positive absolute returns despite a challenging global macro environment (rate hikes, FII outflows), affirming structural domestic demand drivers.
1-Year Annual Returns (2007–2026)
Annual returns of the NIFTY MIDCAP 150 exhibit far greater amplitude than NIFTY 50, with some years producing extraordinary gains (+133.2% in 2010, +75.1% in 2015, +56.3% in 2024) alongside severe drawdowns (-60.8% in 2009, -14.2% in 2016, -12.1% in 2019). This reflects the liquidity-sensitive nature of mid-cap stocks and their amplified response to domestic economic cycles.
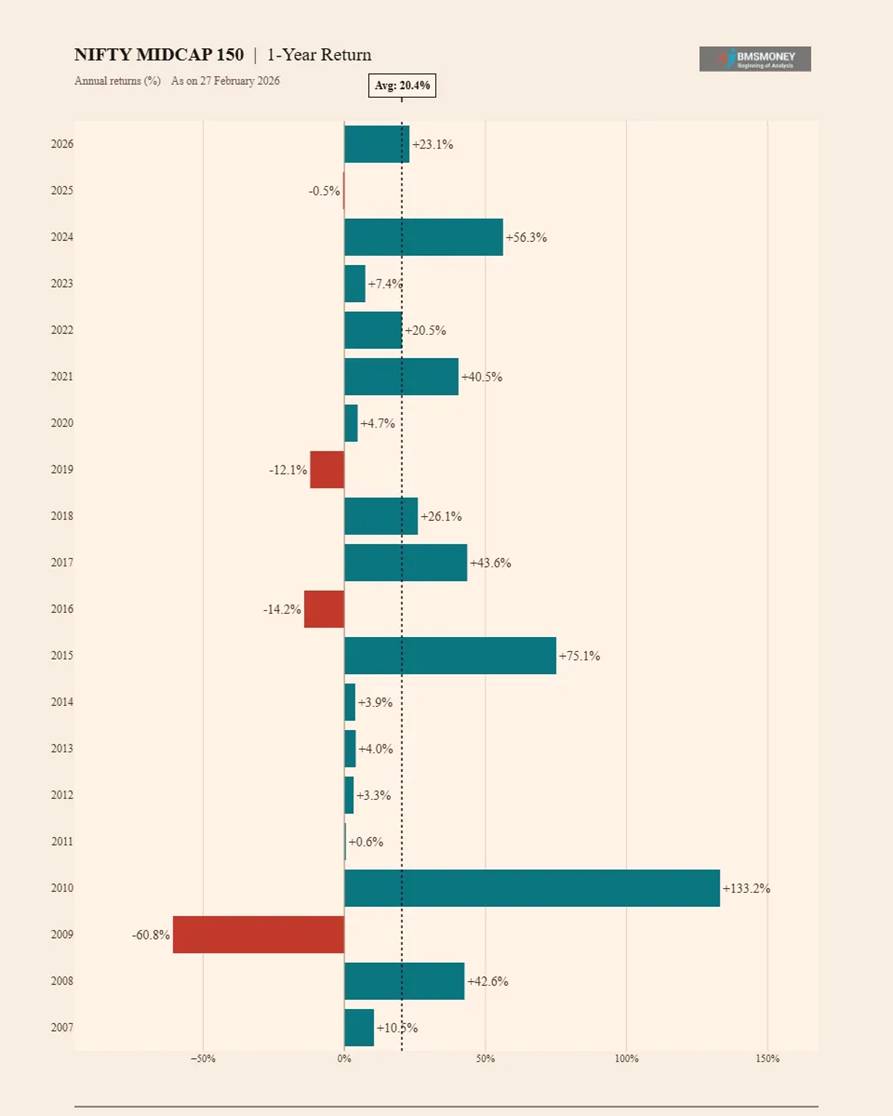
- Average 1-Year Return: 20.4% | Median: 9.0% (mean-median gap of 11.4% signals positive skew)
- Best Year: +133.2% (2010, post-GFC recovery) | Worst Year: -60.8% (2009, GFC trough)
- 16 positive years vs. 4 negative years out of 20 observations.
- Mid-cap stocks tend to recover sharply after crashes: 2010’s +133.2% followed 2009’s -60.8%, a pattern that rewards patient SIP investors.
- Compared to NIFTY 50’s 1Y average of 17.4%, mid-caps outperform by ~300 bps on average but with a higher standard deviation (39.4% vs 35.3%).
3-Year CAGR Returns (2009–2026)
Rolling 3-year CAGRs for MIDCAP 150 show a wide distribution, from -14.8% (ending Feb 2009, capturing the GFC) to +34.3% (ending Feb 2012, the post-GFC surge). Notably, the post-2019 period has seen consistently elevated 3Y CAGRs, with every recent observation above 18%, reflecting the powerful multi-year mid-cap bull market.
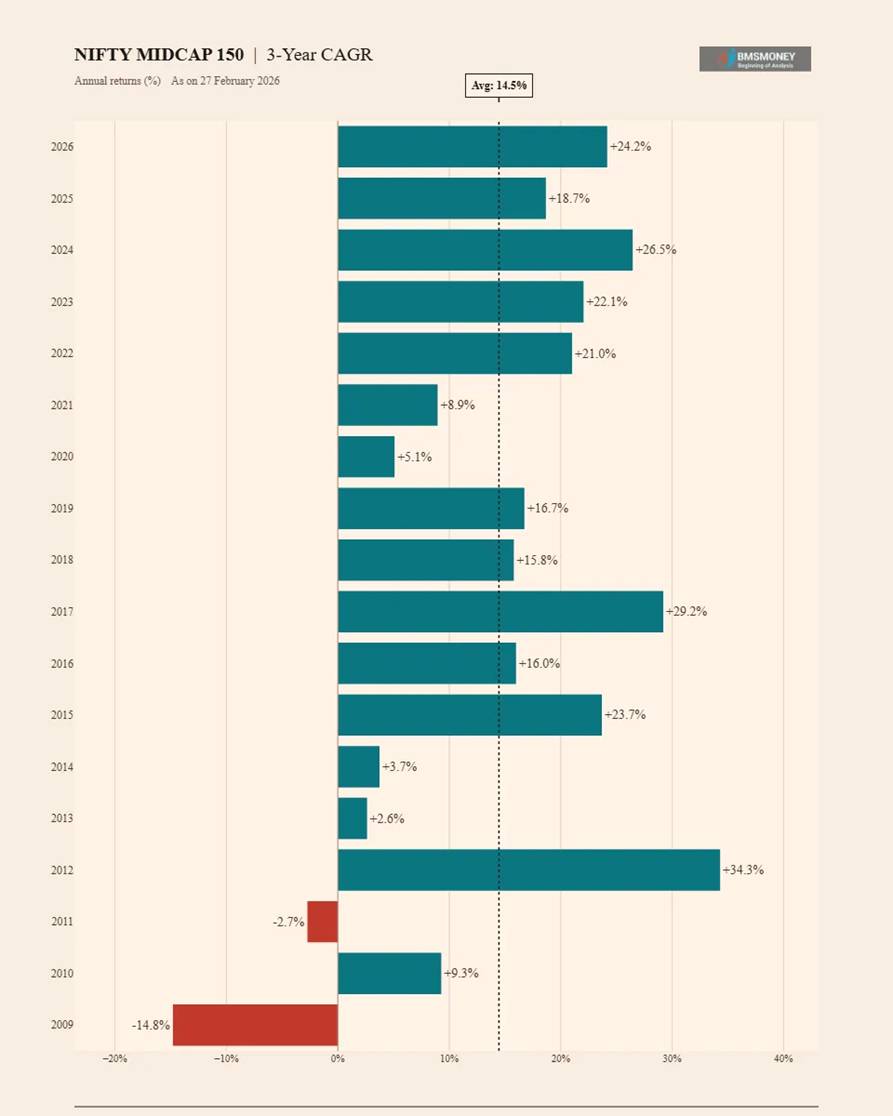
- Average 3-Year CAGR: 14.5% vs NIFTY 50’s 12.2% — a consistent ~230 bps premium.
- Only 2 negative 3-year periods (2009 and 2011), both linked to global financial stress.
- The 2022–2026 cluster shows all 3Y CAGRs above 18%, the highest sustained 3-year performance period in the index’s history.
- Standard deviation of 12.4% is significantly higher than NIFTY 50’s 13.5% at the same horizon (though the dataset size differs).
5-Year CAGR Returns (2011–2026)
The 5-year horizon shows near-elimination of negative return risk, with only a single observation of -0.2% (ending Feb 2013, capturing the 2008–2013 sideways market). From 2014 onwards, every 5-year CAGR has been solidly positive, with recent windows (2024–25–26) clustered in the high teens to mid-twenties.
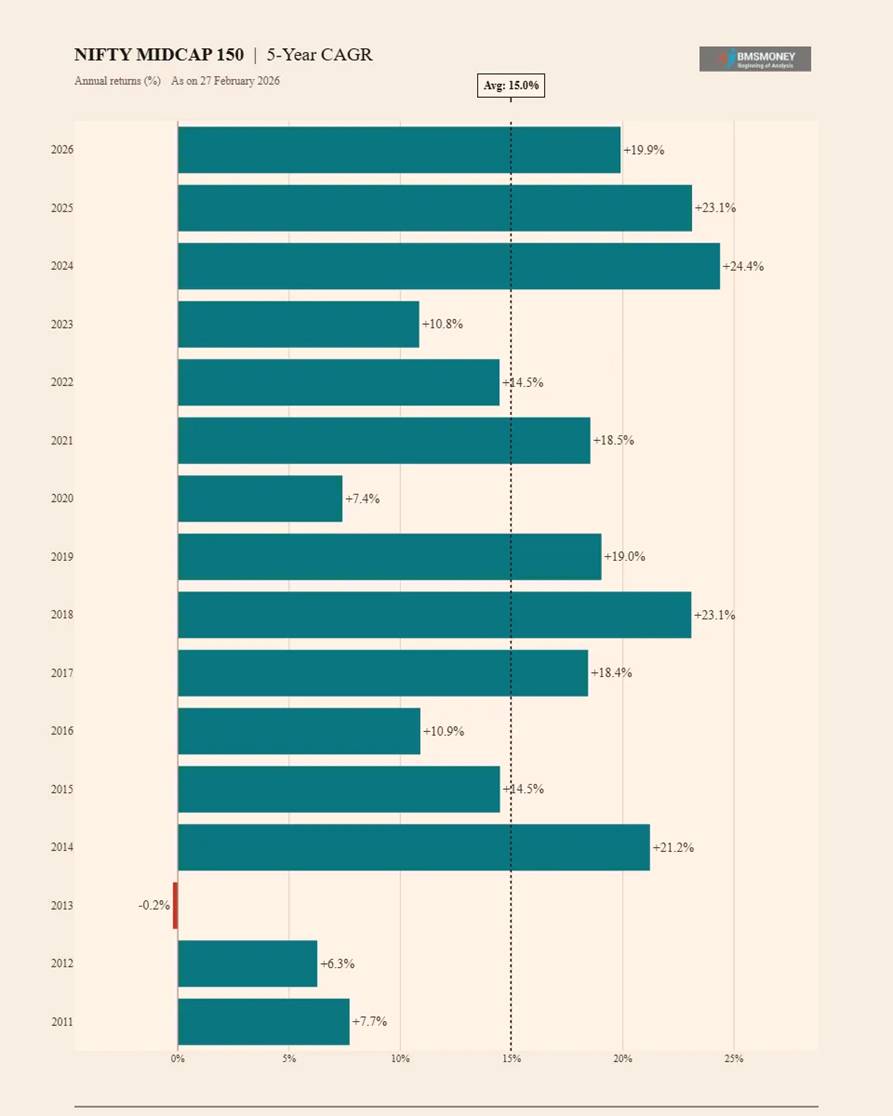
- Average 5-Year CAGR: 15.0% vs NIFTY 50’s 11.2% — a 380 bps premium.
- Only 1 negative 5-year period (-0.2%, 2013) out of 16 observations.
- Peak 5-year CAGR: +24.4% (2024), driven by the strong 2019–2024 equity cycle.
- Standard deviation falls sharply to 7.2%, confirming the mid-cap risk premium reduces dramatically with time.
- Every 5Y CAGR post-2017 is above 10%, indicating the recent structural bull market in Indian mid-caps.
7-Year CAGR Returns (2013–2026)
At the 7-year horizon, NIFTY MIDCAP 150 has delivered a positive CAGR in every single rolling window across its available history — 14 out of 14 observations. The minimum of +5.6% (2014) and maximum of +21.6% (2016) define a range that comfortably exceeds fixed income alternatives, validating the case for long-term mid-cap equity investing.
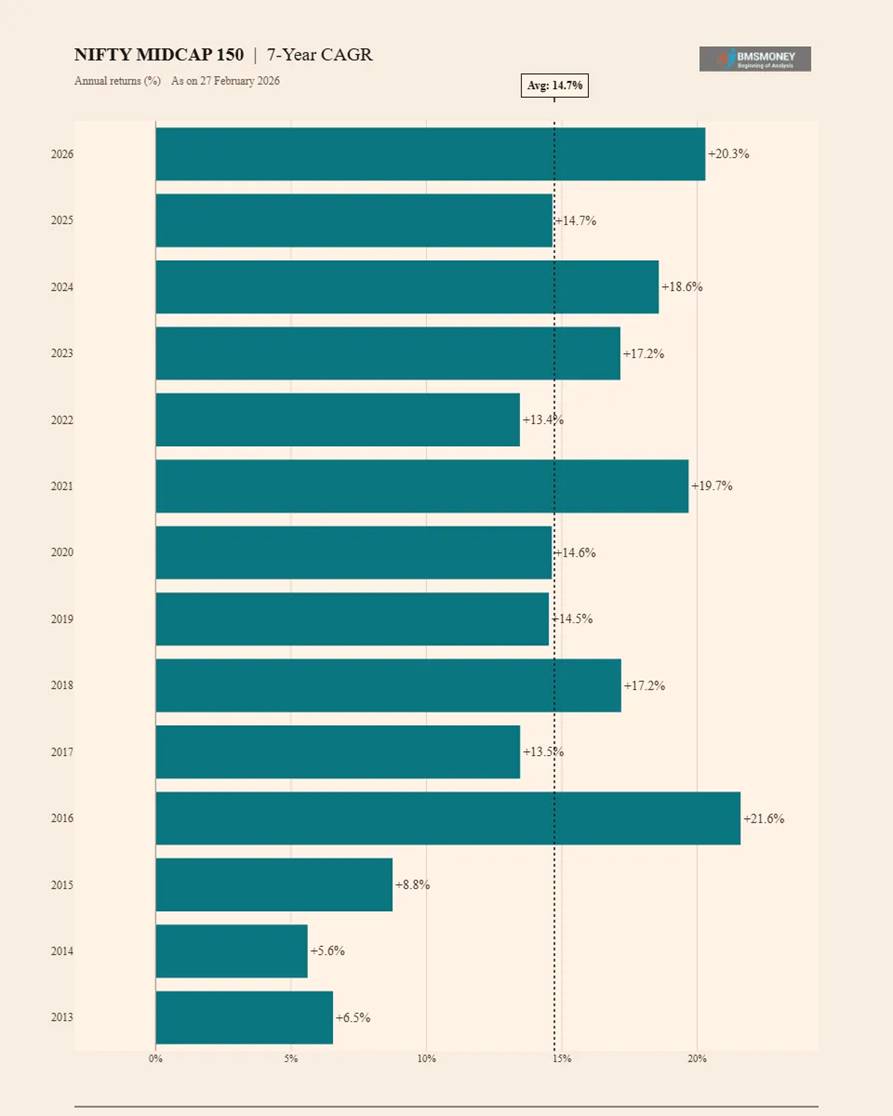
- Average 7-Year CAGR: 14.7% vs NIFTY 50’s 11.2% — a substantial 350 bps premium.
- Zero negative return periods in all 14 observations — matching NIFTY 50’s 7-year record.
- Minimum floor of +5.6% (2014) is notably higher than NIFTY 50’s 7Y floor of +0.0% (2001).
- The 2026 observation of +20.3% is one of the highest in the series, reflecting the strong 2019–2026 period.
- Standard deviation of 5.0% at 7 years is remarkably low given the index’s short-term volatility profile.
10-Year CAGR Returns (2016–2026)
The 10-year CAGR profile of NIFTY MIDCAP 150 is uniformly positive and consistently higher than the NIFTY 50, ranging from +9.3% to +21.7%. This horizon captures at least one full market cycle and demonstrates the index’s ability to generate superior wealth creation for patient investors. The current 10Y CAGR of 19.2% (as of Feb 2026) is the second highest in the available series.
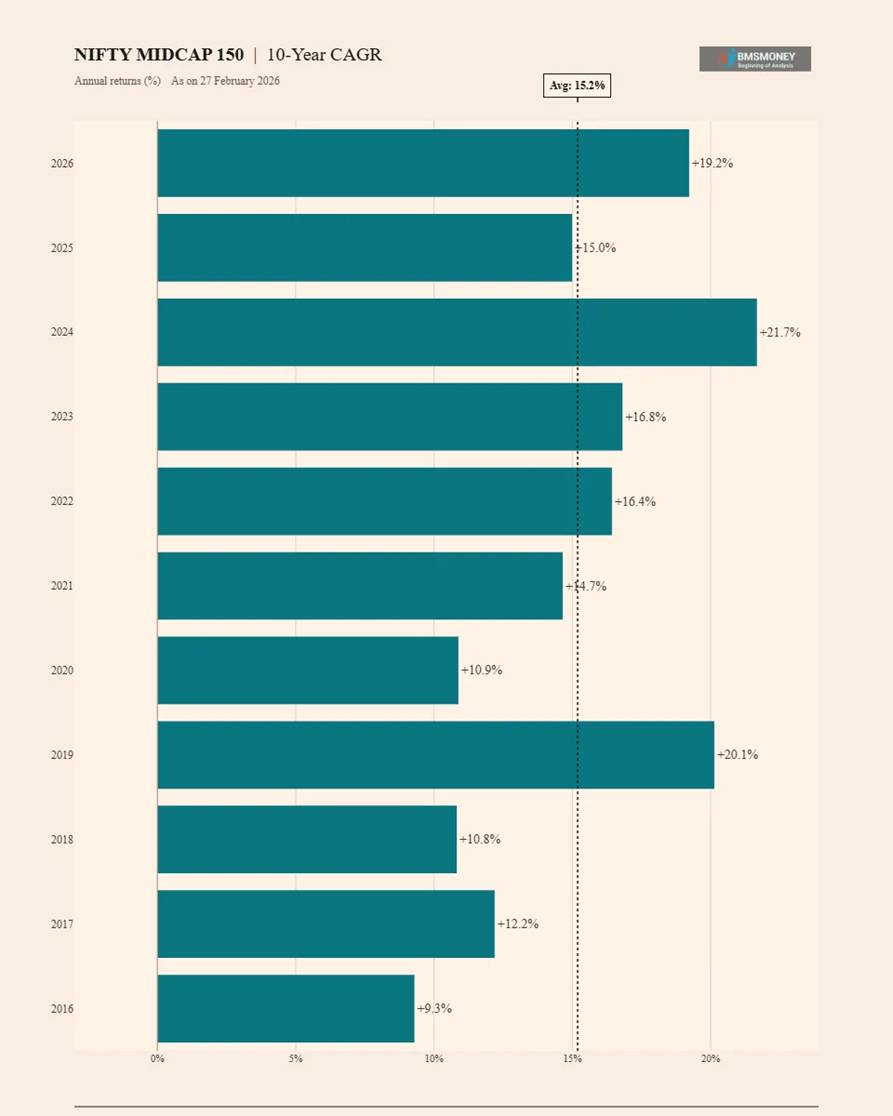
- Average 10-Year CAGR: 15.2% vs NIFTY 50’s 11.3% — the largest alpha gap across all horizons (390 bps).
- Minimum: +9.3% (2016) | Maximum: +21.7% (2024) — all positive, no exceptions.
- The 2024 peak (21.7%) captures the extraordinary 2014–2024 mid-cap decade.
- Current 10Y CAGR (2026) of 19.2% is well above the average, suggesting a strong structural phase for mid-caps.
- The lowest 10Y CAGR of 9.3% (2016) still comfortably exceeds 10-year FD rates, confirming the equity risk premium.
15-Year CAGR Returns (2021–2026)
With 6 data points, the 15-year horizon shows a range of 10.8% to 21.5%. The 2024 observation of +21.5% stands out as the highest, capturing 15 years of transformational growth from 2009 to 2024. All recent observations are in the 10.8%–21.5% band with an average of 14.8%, meaningfully above NIFTY 50’s 11.8% average at the same horizon.
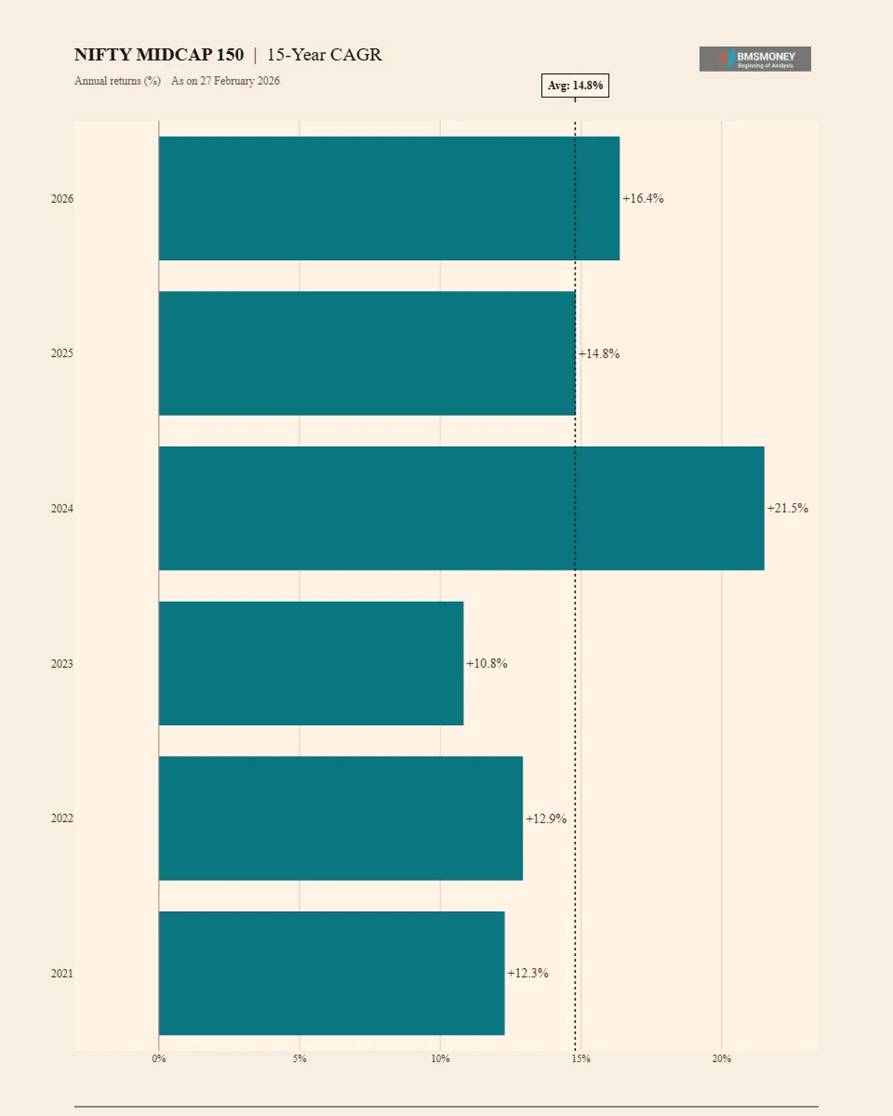
- Average 15-Year CAGR: 14.8% vs NIFTY 50’s 11.8% — a 300 bps structural premium.
- Minimum: +10.8% (both 2023 and 2020) | Maximum: +21.5% (2024).
- Standard deviation of 3.8% shows high consistency over long windows despite mid-cap’s short-term volatility.
- The 2026 observation of 16.4% is above the 6-observation average, pointing to continued robust long-term compounding.
- Even the minimum 15Y CAGR of 10.8% substantially exceeds the NIFTY 50’s 15Y minimum of 4.9%.
20-Year CAGR Return (2026 Only)
The single available 20-year data point (February 2026) shows the NIFTY MIDCAP 150 has compounded at 14.2% per annum over 20 years from 2006 to 2026. This represents approximately 13x wealth multiplication over two decades. As more data points accumulate in coming years, this will be the most powerful indicator of long-term mid-cap compounding in the Indian equity market.
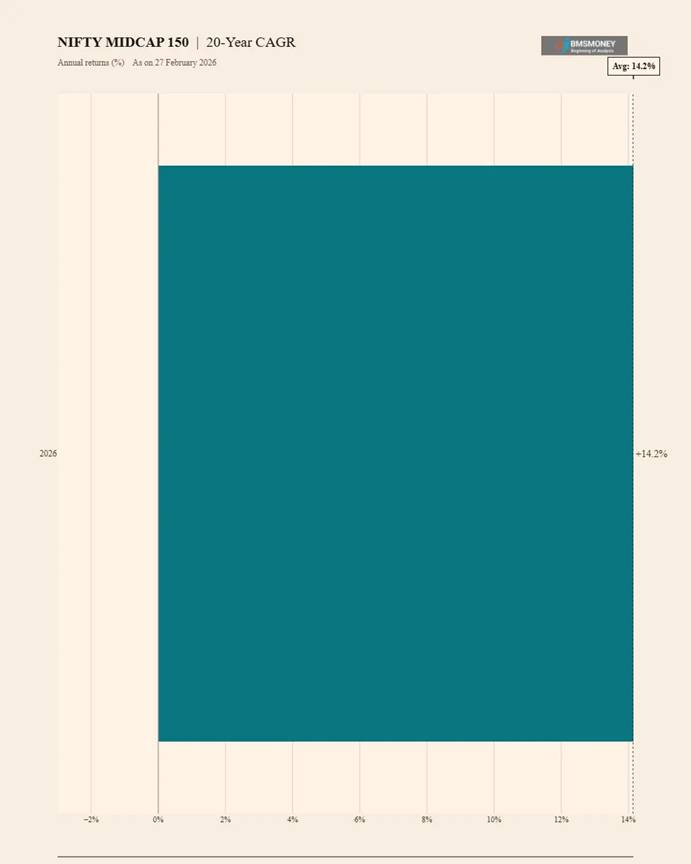
- 20-Year CAGR (2006–2026): 14.2% per annum — vs NIFTY 50’s 11.1% for the same period.
- An investment of ₹1 lakh in Feb 2006 would have grown to approximately ₹13.1 lakhs by February 2026 in MIDCAP 150, compared to approximately ₹8.0 lakhs in NIFTY 50.
- The 3.1 percentage point annual advantage compounds to a significant wealth gap over 20 years, highlighting the power of sustained alpha.
- This single data point will evolve into a rich series over the next 5–10 years as the index accumulates history, making it the most closely watched long-horizon metric for mid-cap investors.
Analytical Insights & Investor Takeaways
The Mid-Cap Premium: Real and Persistent
Across every single horizon from 1-year to 20-year, the NIFTY MIDCAP 150 has outperformed NIFTY 50 on average CAGR. This premium ranges from approximately 230 bps at 3 years to 390 bps at 10 years. Crucially, this alpha is not a statistical artefact of a short dataset — it is consistent across different market regimes (2008 GFC, 2013 taper tantrum, 2016 demonetisation, 2020 COVID, 2022 global rate cycle). The premium likely reflects a genuine risk-return compensation: mid-cap companies are less liquid, less analyst-covered, and more operationally leveraged, warranting a higher required return.
Higher Risk Profile Requires Behavioural Discipline
The flip side of higher long-term returns is more severe short-term drawdowns. The 2009 loss of -60.8% would test any investor’s conviction. However, those who stayed invested (or continued SIPs) were rewarded with +133.2% in the very next year. This pattern of deep drawdown followed by sharp recovery is characteristic of mid-cap indices globally and underscores why systematic investment and a long investment horizon are non-negotiable for mid-cap investors.
The 7-Year Threshold: Zero Negative Returns
Similar to NIFTY 50 (as documented in the BMS Money reference article), the NIFTY MIDCAP 150 has recorded zero negative CAGR across any 7-year rolling window in its history. Moreover, the minimum 7-year CAGR of +5.6% is substantially higher than NIFTY 50’s minimum of +0.0%, suggesting the mid-cap index actually provides a better ‘floor’ return over 7+ year horizons despite its higher short-term risk profile.
Current Valuation Context (Feb 2026)
- The current 1Y return of +23.1% is above the long-run average of 20.4%, suggesting recent momentum.
- The 3Y CAGR of +24.2% and 5Y CAGR of +19.9% are significantly above their respective averages (14.5% and 15.0%), indicating elevated medium-term returns relative to history.
- The 10Y CAGR of 19.2% vs its average of 15.2% shows the decade starting 2016 has been exceptionally strong for mid-caps, aided by formalisation of the economy, GST, and domestic equity inflows.
- Investors entering today should calibrate expectations: future 10-year returns may moderate toward the 13–15% historical average as the base effect normalises.
Role in a Diversified Portfolio
Based on the historical evidence, an optimal allocation to NIFTY MIDCAP 150 for a long-term investor (7+ year horizon) could meaningfully improve portfolio CAGR relative to a pure large-cap (NIFTY 50) strategy. A blended 70:30 (NIFTY 50 : MIDCAP 150) allocation would have delivered a CAGR of approximately 12.2–13.5% over 10 years, with modestly higher volatility than pure large-cap but substantially lower than pure mid-cap. This risk-adjusted sweet spot is why most diversified equity mutual fund portfolios maintain a mid-cap sleeve.
Top Performing Funds for You
Top Performing Equity Funds Top Performing Debt Funds Top Performing Hybrid FundsDisclaimer & References
This report has been prepared by BMS Money Research for informational and educational purposes only. All data represents historical returns of the NIFTY MIDCAP 150 and NIFTY 50 indices and does not guarantee future performance. Past performance is not indicative of future results.
This report does not constitute investment advice, a solicitation to buy or sell securities, or a recommendation regarding any specific financial product. Investors should consult a SEBI-registered investment advisor before making any investment decisions. Equity investments are subject to market risk; please read all scheme-related documents carefully.
Data Sources & References
- BMS Money (bmsmoney.com) — Primary data source for all NIFTY 50 and NIFTY MIDCAP 150 return calculations.
- Reference Article: “Decades of NIFTY 50 Performance: A Comprehensive Analysis of Returns from 1991 to 2024” — BMS Money (https://www.bmsmoney.com/article/full/decades-of-nifty-50-performance-a-comprehensive-analysis-of-returns-from-1991-to-2024/)
- NSE India — NIFTY MIDCAP 150 Index methodology and historical data.
- Data as on: 27 February 2026
Top Performing Equity Fund Categories for You
Top Performing Large Cap Funds Top Performing Mid Cap Funds Top Performing Small Cap Funds|
Horizon |
Mean CAGR |
Volatility |
Downside |
Best Use-Case |
|
1-Year |
18.3% |
27.2% |
30% |
Tactical trades |
|
3-Year |
15.6% |
11.1% |
11% |
Medium-term goals |
|
5-Year |
15.3% |
8.5% |
0% |
Core SIP |
|
7-Year |
14.1% |
3.7% |
0% |
Education / home corpus |
|
10-Year |
15.0% |
3.7% |
0% |
Retirement satellite |
|
15-Year |
14.3% |
2.4% |
0% |
Legacy planning |
Conclusion
The NIFTY MIDCAP 150 Index data reveals a clear pattern: short-term returns can be unpredictable, but long-term investing offers steady growth. For investors in India’s midcap market, this suggests focusing on longer horizons to reduce risk and capture consistent returns. However, past performance isn’t a sure predictor of the future. You’d need to consider other factors, such as economic conditions or sector trends, to make informed choices. For now, the data suggests staying patient with midcaps, as the numbers tend to work in your favor over time.