- Nippon India Large Cap Fund has given the best return in the category over the past 3, 5, and 10 years.
- Nippon India Small Cap fund has the highest return for the small-cap category for a 3 and 10-year period.
Lumpsum Return Analysis
The table below shows the return on equity funds from Nippon India AMC. The returns are calculated for the Direct Growth Plan on 30 September 2024. These are all lumpsum investment returns. The analysis is performed for the equity funds that are five or more years old.
- For a 1-year return, four funds are in the top quartile.
- For the 3-year return period, eight funds are in the top quartile.
- Eight funds are in the top quartile for the 5-year return period.
- The ten-year return period is not that good, only five funds are in the top quartile.
| Fund Name | Category | 1Y Return | 3Y Return | 5Y Return | 10Y Return | 1Y Percentile | 3Y Percentile | 5Y Percentile | 10Y Percentile |
|---|---|---|---|---|---|---|---|---|---|
| Nippon India Banking & Financial Services Fund | Banking and Financial Services Fund | 29.92 | 19.88 | 18.66 | 15.62 | 58.82 | 92.31 | 81.82 | 50.00 |
| Nippon India Consumption Fund | Consumption Fund | 50.49 | 26.31 | 28.24 | 17.55 | 78.57 | 90.91 | 100.00 | 50.00 |
| Nippon India ELSS Tax Saver Fund | ELSS (Tax Saving) Fund | 44.95 | 21.25 | 22.42 | 13.12 | 62.50 | 69.70 | 53.12 | 4.35 |
| Nippon India Power & Infra Fund | Energy Fund | 64.82 | 35.88 | 32.85 | 19.09 | 100.00 | 100.00 | 100.00 | 50.00 |
| Nippon India Focused Equity Fund | Focused Fund | 32.89 | 18.10 | 23.54 | 16.63 | 14.29 | 31.82 | 68.75 | 75.00 |
| Nippon India Japan Equity Fund | International Fund | 25.93 | 4.53 | 9.57 | 8.19 | 42.86 | 28.57 | 33.33 | 40.00 |
| Nippon India Vision Fund | Large & Mid Cap Fund | 50.38 | 22.24 | 24.48 | 14.96 | 69.23 | 65.38 | 40.91 | 17.65 |
| Nippon India Large Cap Fund | Large Cap Fund | 40.37 | 23.22 | 23.23 | 16.84 | 56.67 | 100.00 | 100.00 | 100.00 |
| Nippon India Growth Fund | Mid Cap Fund | 54.74 | 28.57 | 32.41 | 20.55 | 62.96 | 77.27 | 80.00 | 70.59 |
| Nippon India Multi Cap Fund | Multi Cap Fund | 46.93 | 29.17 | 27.70 | 17.39 | 40.91 | 100.00 | 71.43 | 40.00 |
| Nippon India Pharma Fund | Pharma Fund | 49.71 | 20.43 | 31.27 | 16.73 | 10.00 | 37.50 | 37.50 | 100.00 |
| Nippon India Quant Fund | Quant Fund | 48.26 | 23.47 | 24.27 | 14.92 | 62.50 | 83.33 | 100.00 | 100.00 |
| Nippon India us equity opportunities fund | Sectoral/ Thematic Fund | 32.02 | 10.54 | 16.71 | - | 85.71 | 71.43 | 83.33 | - |
| Nippon India Small Cap Fund | Small Cap Fund | 49.69 | 32.08 | 38.33 | 24.71 | 65.22 | 100.00 | 88.24 | 100.00 |
| Nippon India Value Fund | Value Fund | 56.09 | 25.52 | 27.52 | 18.75 | 90.00 | 66.67 | 66.67 | 90.00 |
This table gives us a look at how Nippon India's mutual funds have performed if someone made a one-time (lump sum) investment and held onto it over different periods: 1 year, 3 years, 5 years, and 10 years. It helps us understand which funds did well recently and which ones have been consistent over a longer time.
Starting with the most recent performance (1-year returns), a few funds stand out with high numbers. For example, the Consumption Fund has a 1-year return of 50.49%, and the Power & Infra Fund boasts an impressive 64.82%. These numbers show that these funds have done really well over the past year, likely due to favorable conditions in their specific areas or industries. However, it's important to remember that these are past returns, which means these high numbers aren’t a promise of future gains, just a record of how these funds performed recently.
Looking at the 3- and 5-year returns gives us a better idea of which funds have managed to stay stable over a medium period. The Growth Fund, for instance, has a 3-year return of 28.57% and a 5-year return of 32.41%. This suggests that over these periods, the Growth Fund has provided steady returns, handling both the ups and downs of the market reasonably well. Another similar fund, the Multi Cap Fund, also has a decent track record, showing returns of 29.17% over 3 years and 27.70% over 5 years.
Now, if we look at the longest period, the 10-year returns, we can see which funds have managed to perform consistently over an entire decade. Funds like the Large Cap Fund and the Growth Fund have shown steady growth here, with 10-year returns of 19.28% and 20.55%, respectively. This indicates that these funds have been able to ride through all sorts of market conditions over the years and still come out with decent returns.
The percentile ranks add another layer to this data. These ranks show how each fund did compared to other funds in the same category. For example, the Large Cap Fund consistently ranks high in the 5- and 10-year percentiles, meaning it has held its ground better than many other similar funds in the long run. Seeing a fund with high percentile ranks over longer periods suggests it has maintained a solid position compared to its competitors.
In summary, this table is a historical snapshot, giving you an idea of which funds have performed well recently and which ones have stayed stable over the years. It’s a useful reference, especially if you’re curious about how different funds have handled past market conditions.
Key Insight:
-
Top Performers: The Nippon India Large Cap Fund, Nippon India Small Cap Fund, and Nippon India Power & Infra Fund stand out with 100th percentile rankings in multiple time periods, making them the best in their categories over specific periods.
-
Strong Short-Term Performance: Funds like Nippon India Power & Infra Fund excel in short-term returns, ranking in the 100th percentile over 1, 3, and 5 years.
-
Consistent Long-Term Performers: The Nippon India Large Cap Fund and Nippon India Small Cap Fund maintain 100th percentile rankings over long periods (3-, 5-, and 10-years), making them excellent choices for long-term investors.
-
Improvement Needed: The Nippon India ELSS Tax Saver Fund ranks poorly in the 10-year period, placing it among the worst in its category, despite showing average performance in shorter periods.
SIP Return Analysis
The table below shows the SIP returns of Nippon India equity funds, the analysis is done for direct growth plans.
- Only one fund SIP return is in the top quartile for a 1-year SIP return period.
- 10 funds SIP return are in the top quartile for a 3-year SIP period.
- For the 5-year SIP period, 10 funds SIP return are in the top quartile.
- Nine funds SIP return are in the top quartile for the SIP period of 10 years.
| Fund Name | Category | 1Y XIRR | 3Y XIRR | 5Y XIRR | 10Y XIRR | 1Y Percentile | 3Y Percentile | 5Y Percentile | 10Y Percentile |
|---|---|---|---|---|---|---|---|---|---|
| Nippon India ELSS Tax Saver Fund | ELSS | 45.26 | 31.09 | 28.23 | 16.27 | 57.50 | 72.73 | 68.75 | 17.39 |
| Nippon India Focused Equity Fund | Focussed Fund | 36.77 | 25.82 | 26.29 | 18.16 | 11.54 | 22.73 | 62.50 | 58.33 |
| Nippon India Vision Fund | Large & Mid Cap Fund | 50.40 | 34.04 | 29.84 | 18.28 | 65.38 | 65.38 | 68.18 | 23.53 |
| Nippon India Large Cap Fund | Large Cap Fund | 40.45 | 31.50 | 29.18 | 19.28 | 56.67 | 100.00 | 100.00 | 100.00 |
| Nippon India Growth Fund | Mid Cap Fund | 56.11 | 41.31 | 37.48 | 24.19 | 59.26 | 77.27 | 85.00 | 88.24 |
| Nippon India Multi Cap Fund | Multi Cap Fund | 49.30 | 38.43 | 35.85 | 21.65 | 68.18 | 100.00 | 100.00 | 80.00 |
| Nippon India Banking & Financial Services Fund | Sectoral/ Thematic-Banking and Financial | 33.07 | 26.23 | 25.66 | 16.66 | 58.82 | 84.62 | 100.00 | 75.00 |
| Nippon India Consumption Fund | Sectoral/ Thematic-Consumption | 57.35 | 35.90 | 32.77 | 21.22 | 57.14 | 90.91 | 90.91 | 62.50 |
| Nippon India Power & Infra Fund | Sectoral/ Thematic-Energy | 55.92 | 49.48 | 42.42 | 24.32 | 100.00 | 100.00 | 100.00 | 100.00 |
| Nippon India Japan Equity Fund | Sectoral/ Thematic-International | 26.71 | 15.20 | 10.76 | 8.22 | 66.67 | 40.00 | 50.00 | 66.67 |
| nippon india us equity opportunities fund | Sectoral/ Thematic-International | 24.14 | 16.55 | 14.37 | NaN | 50.00 | 80.00 | 75.00 | NaN |
| Nippon India Pharma Fund | Sectoral/ Thematic-Pharma | 52.44 | 35.21 | 29.45 | 20.70 | 10.00 | 12.50 | 25.00 | 100.00 |
| Nippon India Quant Fund | Sectoral/ Thematic-Quant | 44.84 | 33.09 | 29.09 | 19.04 | 62.50 | 83.33 | 100.00 | 100.00 |
| Nippon India Small Cap Fund | Small Cap Fund | 49.21 | 41.63 | 42.72 | 27.88 | 65.22 | 80.95 | 94.12 | 91.67 |
| Nippon India Value Fund | Value Fund | 51.45 | 37.48 | 33.38 | 21.59 | 73.68 | 86.67 | 75.00 | 90.00 |
This table focuses on the performance of Nippon India’s mutual funds for people who invested through SIPs (Systematic Investment Plans). SIPs involve putting in a fixed amount regularly, like monthly, instead of investing a lump sum all at once. The table shows how these funds did over different time periods—1, 3, 5, and 10 years—as of September 30, 2024.
Starting with 1-year returns, some funds have really stood out. The Consumption Fund, for instance, has a 1-year SIP return of 57.35%, and the Power & Infra Fund follows closely with 55.92%. These returns tell us that these funds had a strong year recently. This could be due to factors like sector-specific growth or favorable market conditions. However, as always with investing, past performance doesn’t guarantee future results; it’s just a record of what happened.
When we look at the 3- and 5-year SIP returns, we get a sense of which funds have managed steady returns over a medium term. The Growth Fund, for example, shows a 5-year return of 37.48%, which suggests it has provided decent growth for those who invested regularly over this period. The Multi Cap Fund also performed steadily, with a 5-year return of 35.85%. This kind of data can give an idea of how well these funds handled market changes over a few years.
The 10-year returns give us insight into the funds that have been consistent performers for those who stayed invested for the long haul. The Large Cap Fund has a 10-year return of 21.15%, and the Growth Fund follows closely with 21.59%. These funds have been around for a decade, through all sorts of market conditions, and have provided steady growth over time.
The percentile ranks give us more context by showing how each fund performed compared to similar funds. Funds like the Large Cap Fund consistently rank high over the long term, particularly in the 5- and 10-year categories, meaning they’ve held their place well among competitors. High percentile ranks in these longer periods show which funds have been able to sustain their performance compared to other funds in the same category.
In a nutshell, this table provides a snapshot of how different funds performed for SIP investors over various periods. It highlights short-term high performers as well as long-term steady options. This helps you understand how SIPs in these funds have fared under different market conditions, serving as a guide to their historical performance.
Key Insights:
- Best Long-Term Performer: The Nippon India Large Cap Fund is the top choice for long-term SIP investors, ranking in the 100th percentile over 3-, 5-, and 10-year periods.
- Strong Small Cap Option: The Nippon India Small Cap Fund delivers excellent long-term performance, ranking in the 91.67th percentile over 10 years, making it one of the best options for small-cap SIP investments.
- Moderate Performer for Tax-Saving: The Nippon India ELSS Tax Saver Fund performs well in the short and medium term but significantly underperforms over 10 years.
- Growth Focused Fund: The Nippon India Growth Fund offers strong returns over the long term, ranking in the 88.24th percentile over 10 years, making it a good choice for growth-oriented SIP investors.
- Short-Term Performer: The Nippon India Consumption Fund excels in the short term but underperforms in the long term, indicating it's better suited for short- to mid-term investors.
Top Performing Funds for You
Top Performing Equity Funds Top Performing Debt Funds Top Performing Hybrid FundsFuture Prospects
The Ljung-Box test and the Hurst exponent together provide deeper insights into a fund’s return patterns, helping investors assess the consistency and potential predictability of those returns.
The Ljung-Box Test
The Ljung-Box test examines whether there are predictable patterns in a fund’s returns. It calculates a “p-value,” where a low p-value (typically below 0.05) suggests that past returns may influence future returns, indicating a potential pattern in performance. High p-values suggest that returns are closer to random, with less likelihood of predictable trends.
The Hurst Exponent
The Hurst exponent adds another layer to this analysis by measuring the "memory" or persistence of a fund's returns. Values for the Hurst exponent range between 0 and 1:
- Above 0.5: Indicates persistent behavior, meaning past trends are likely to continue. For instance, if a fund's recent trend is positive, it will likely stay positive.
- Around 0.5: Suggests randomness, where past returns don’t affect future ones significantly. This is typical of funds with no predictable patterns.
- Below 0.5: Indicates mean-reverting behavior, where returns tend to oscillate around a certain value. If a fund recently performed well, it might revert to lower returns, and vice versa.
By leveraging the insights from the Ljung-Box test and the Hurst exponent, investors can better identify funds aligned with their risk tolerance and performance expectations.
The Ljung-Box Test Results for Nippon India Equity Mutual Fund
- First eight funds have p-values of less than 0.05 suggesting past returns may influence future returns. We are adding hurst exponent results for each individual fund below to confirm the pattern.
| Fund Name | p-value | lb_stat |
|---|---|---|
| Nippon India Banking & Financial Services Fund | 0.0 | 225.17 |
| Nippon India Focused Equity Fund | 0.0 | 187.20 |
| Nippon India Large Cap Fund | 0.0 | 219.59 |
| Nippon India Multi Cap Fund | 0.0 | 190.03 |
| Nippon India Pharma Fund | 0.0 | 186.09 |
| Nippon India Tax Saver Fund | 0.0 | 215.11 |
| Nippon India Vision Fund | 0.0 | 190.73 |
| Nippon India Power & Infra Fund | 0.08 | 151.41 |
| Nippon India Value Fund | 0.09 | 150.23 |
| Nippon India Quant Fund | 0.13 | 146.50 |
| Nippon India Growth Fund | 0.16 | 143.99 |
| Nippon India Small Cap Fund | 0.17 | 143.29 |
| Nippon India Consumption Fund | 0.21 | 140.73 |
Nippon India Banking & Financial Services Fund
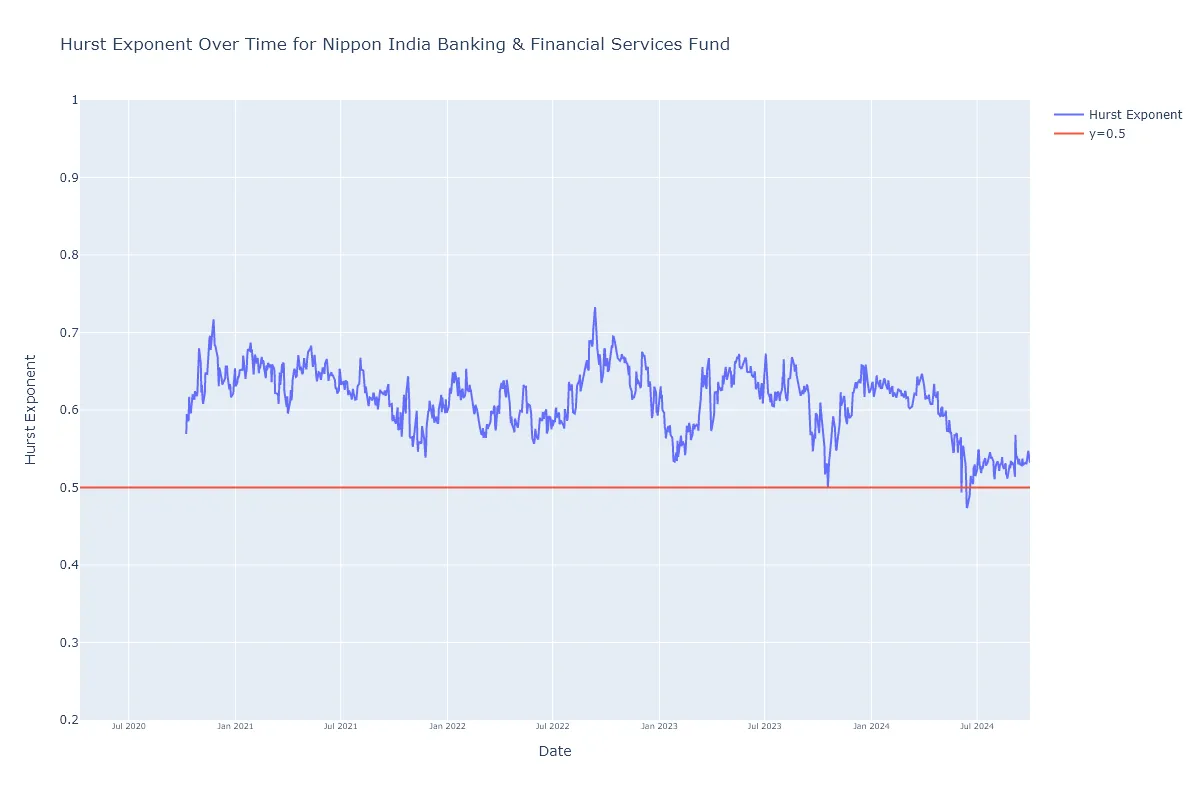
As it can be seen from the chart the Hurst exponent is above 0.5 barring a few instances, we can clearly say that the returns are persistent for Nippon India Banking & Financial Services Fund.
Nippon India Focused Equity Fund
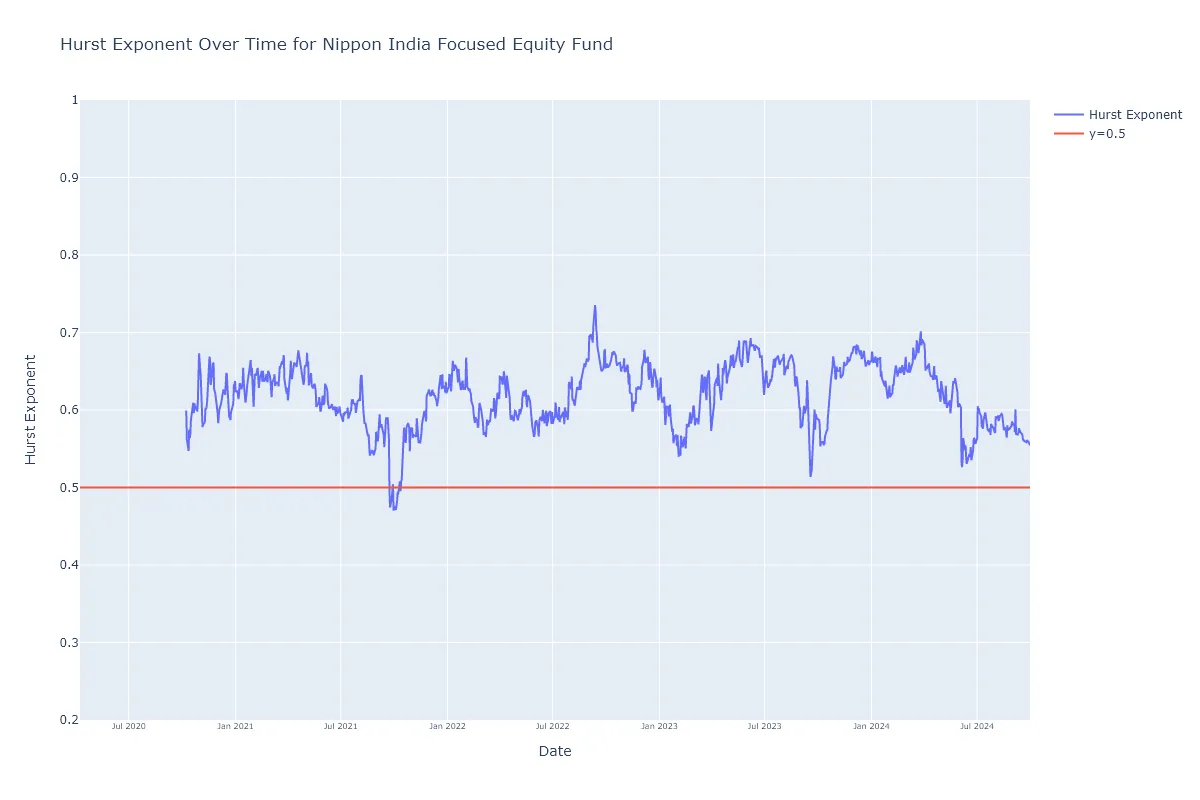
Here also Hurst exponent is above 0.5 showing a persistent return pattern for Nippon India Focused Equity Fund.
Nippon India Large Cap Fund
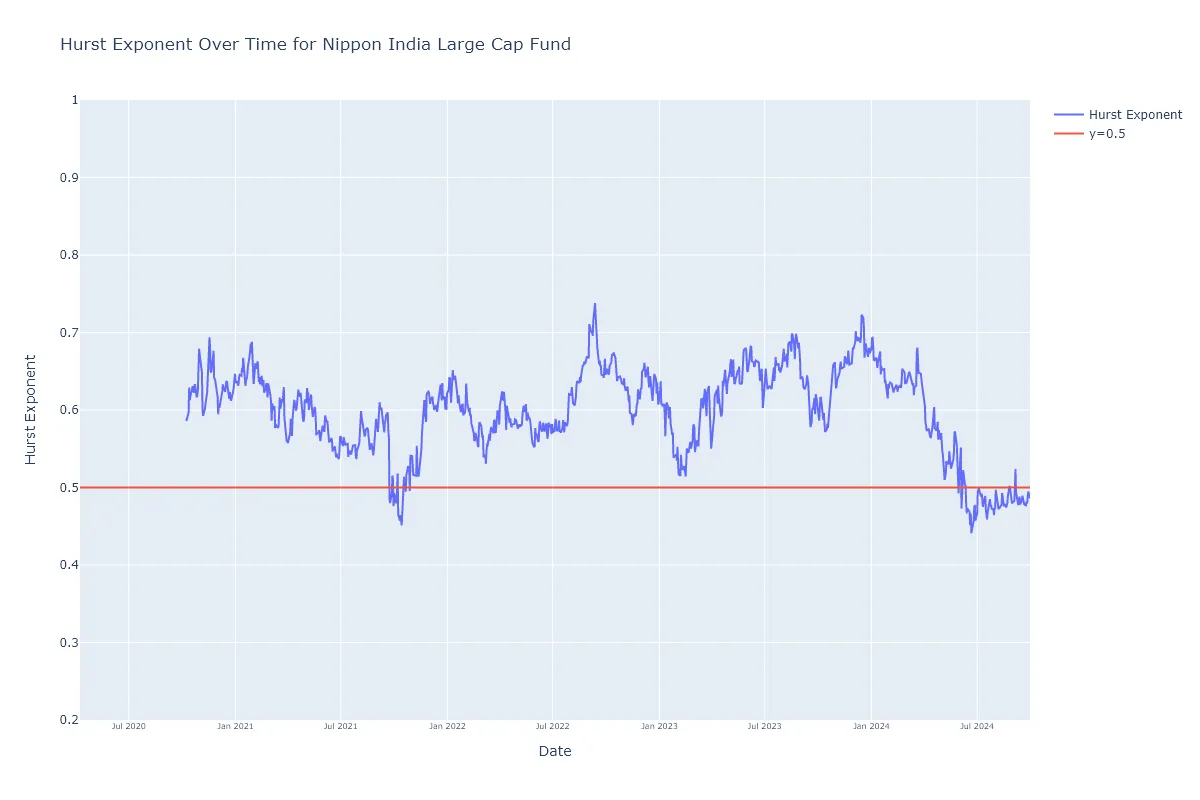
Of late the Hurst exponent has gone below 0.5 for Nippon India Large Cap Fund showing lack of consistent performance.
Nippon India Multi Cap Fund
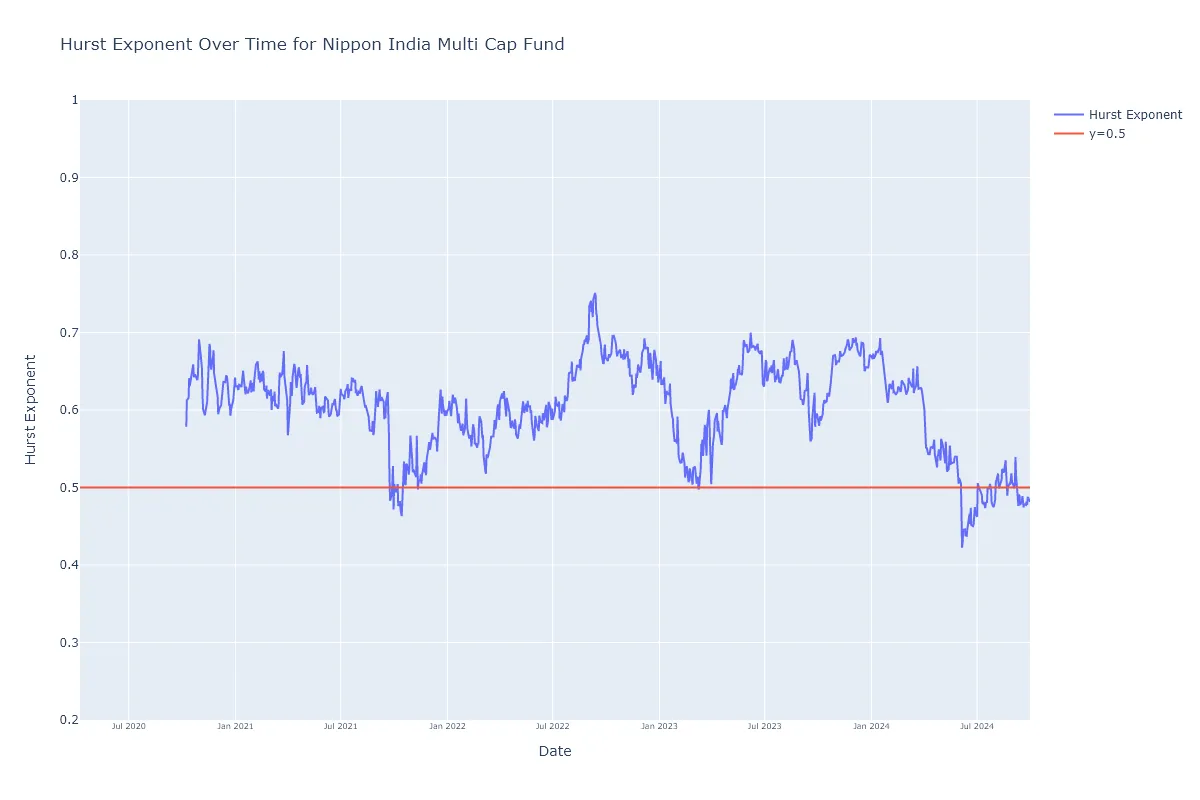
Nippon India Multi Cap Fund has similar case like Large cap fund.
Nippon India Pharma Fund
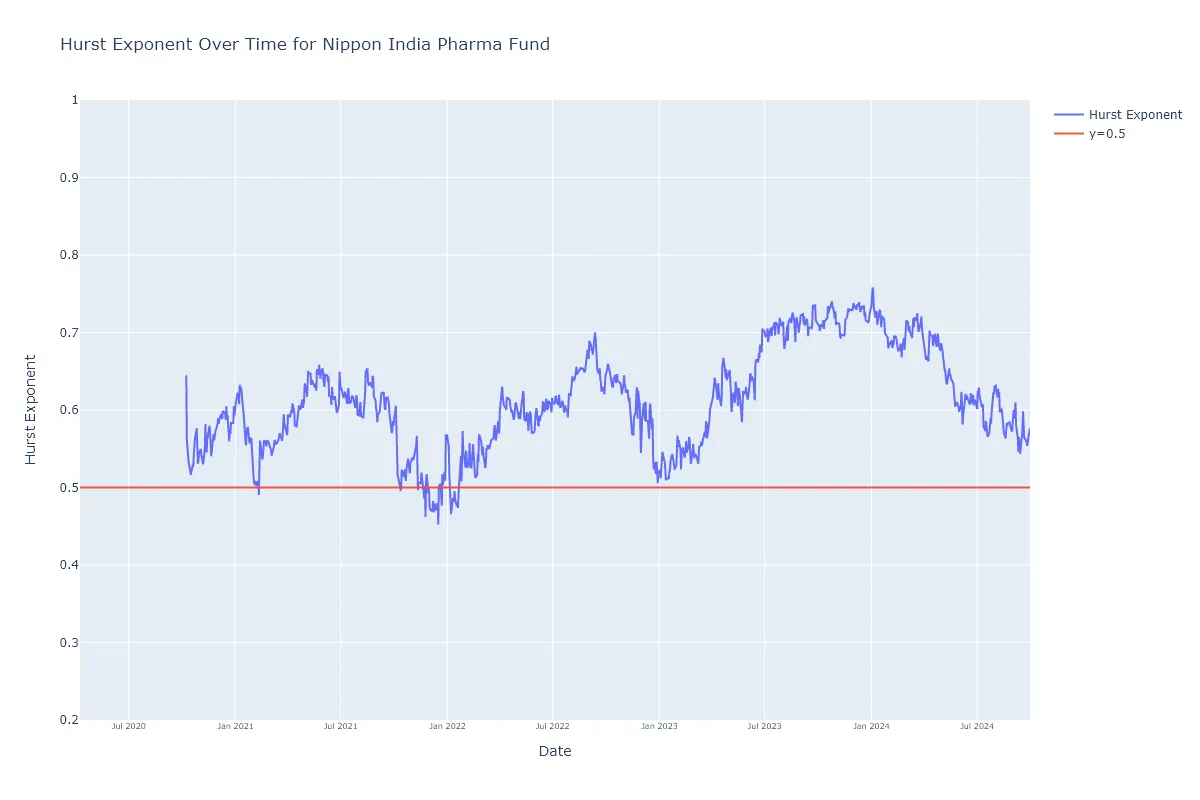
Nippon India Pharma Fund is showing consistent reruns as Hurst exponent is above 0.5.
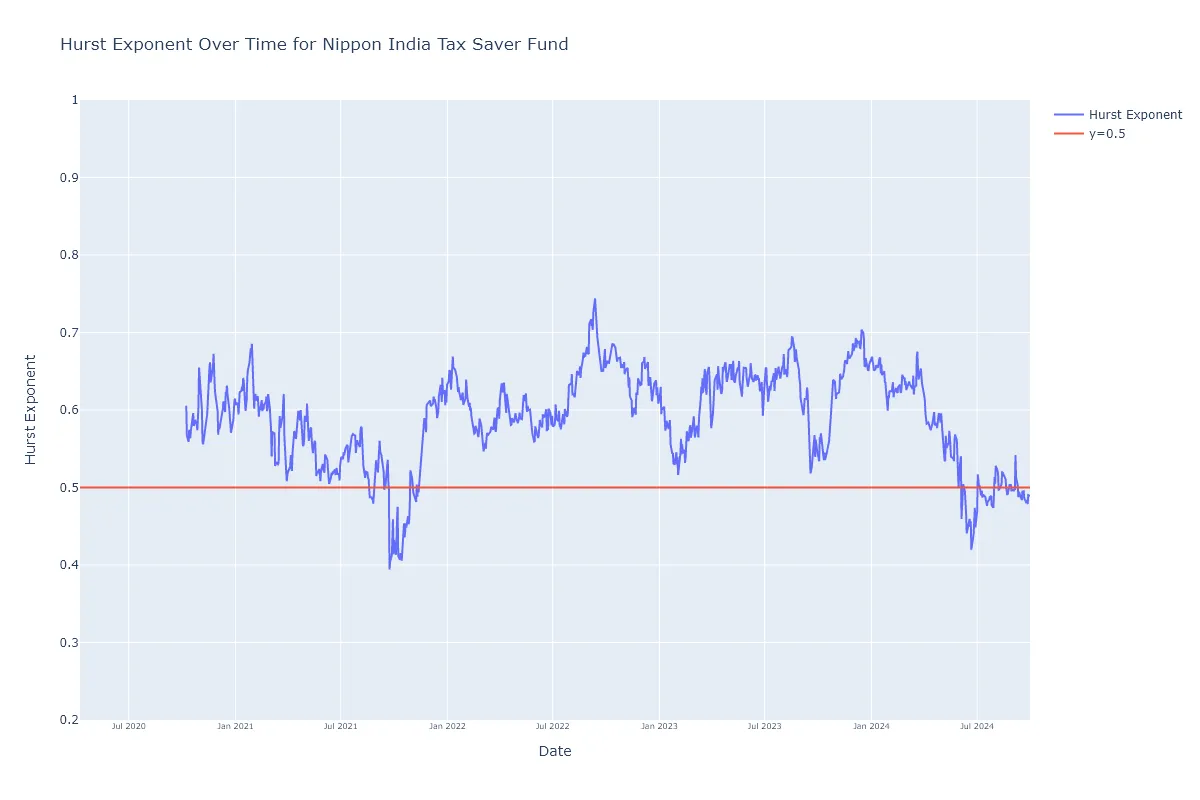
Nippon India Tax Saver Fund
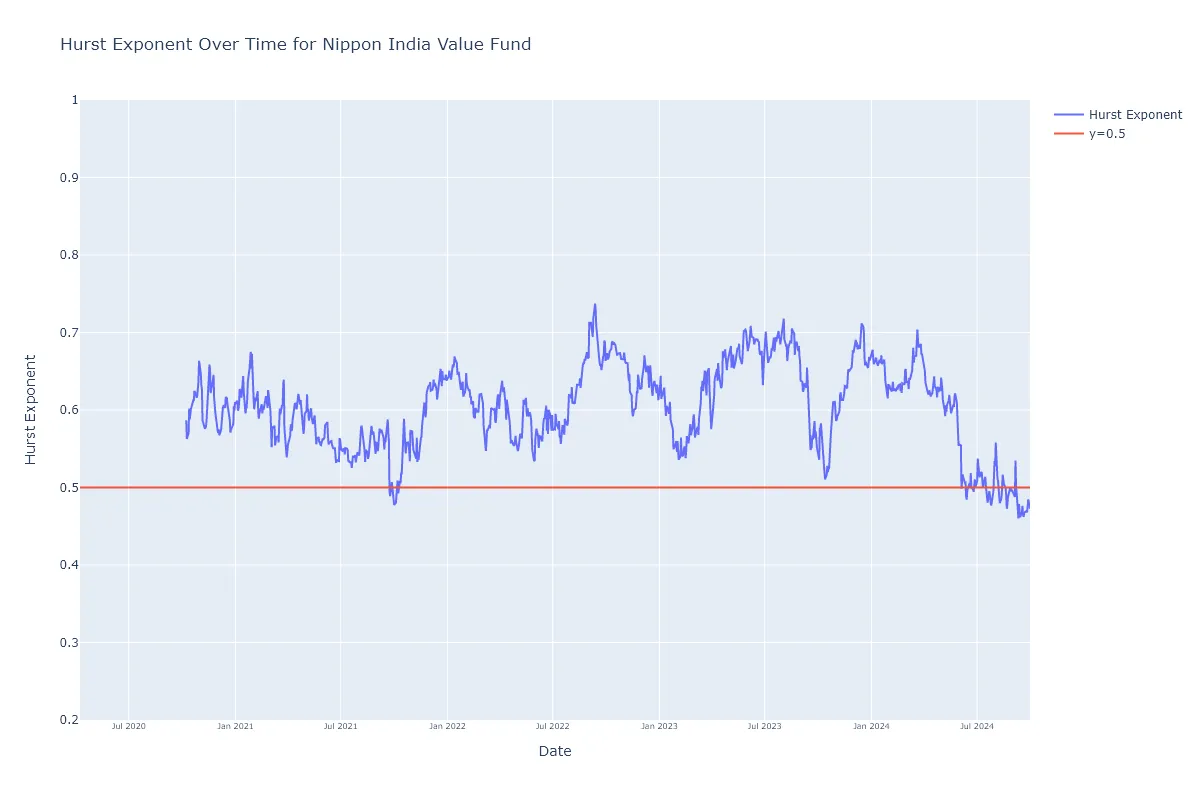
Nippon India Vision Fund
Conclusion
Hurst Exponent and Ljung-Box test for Nippon India Banking & Financial Services Fund, Nippon India Focused Equity Fund and Nippon India Pharma Fund pass cut off of consistent return provider and we expected to these funds to do better in future.