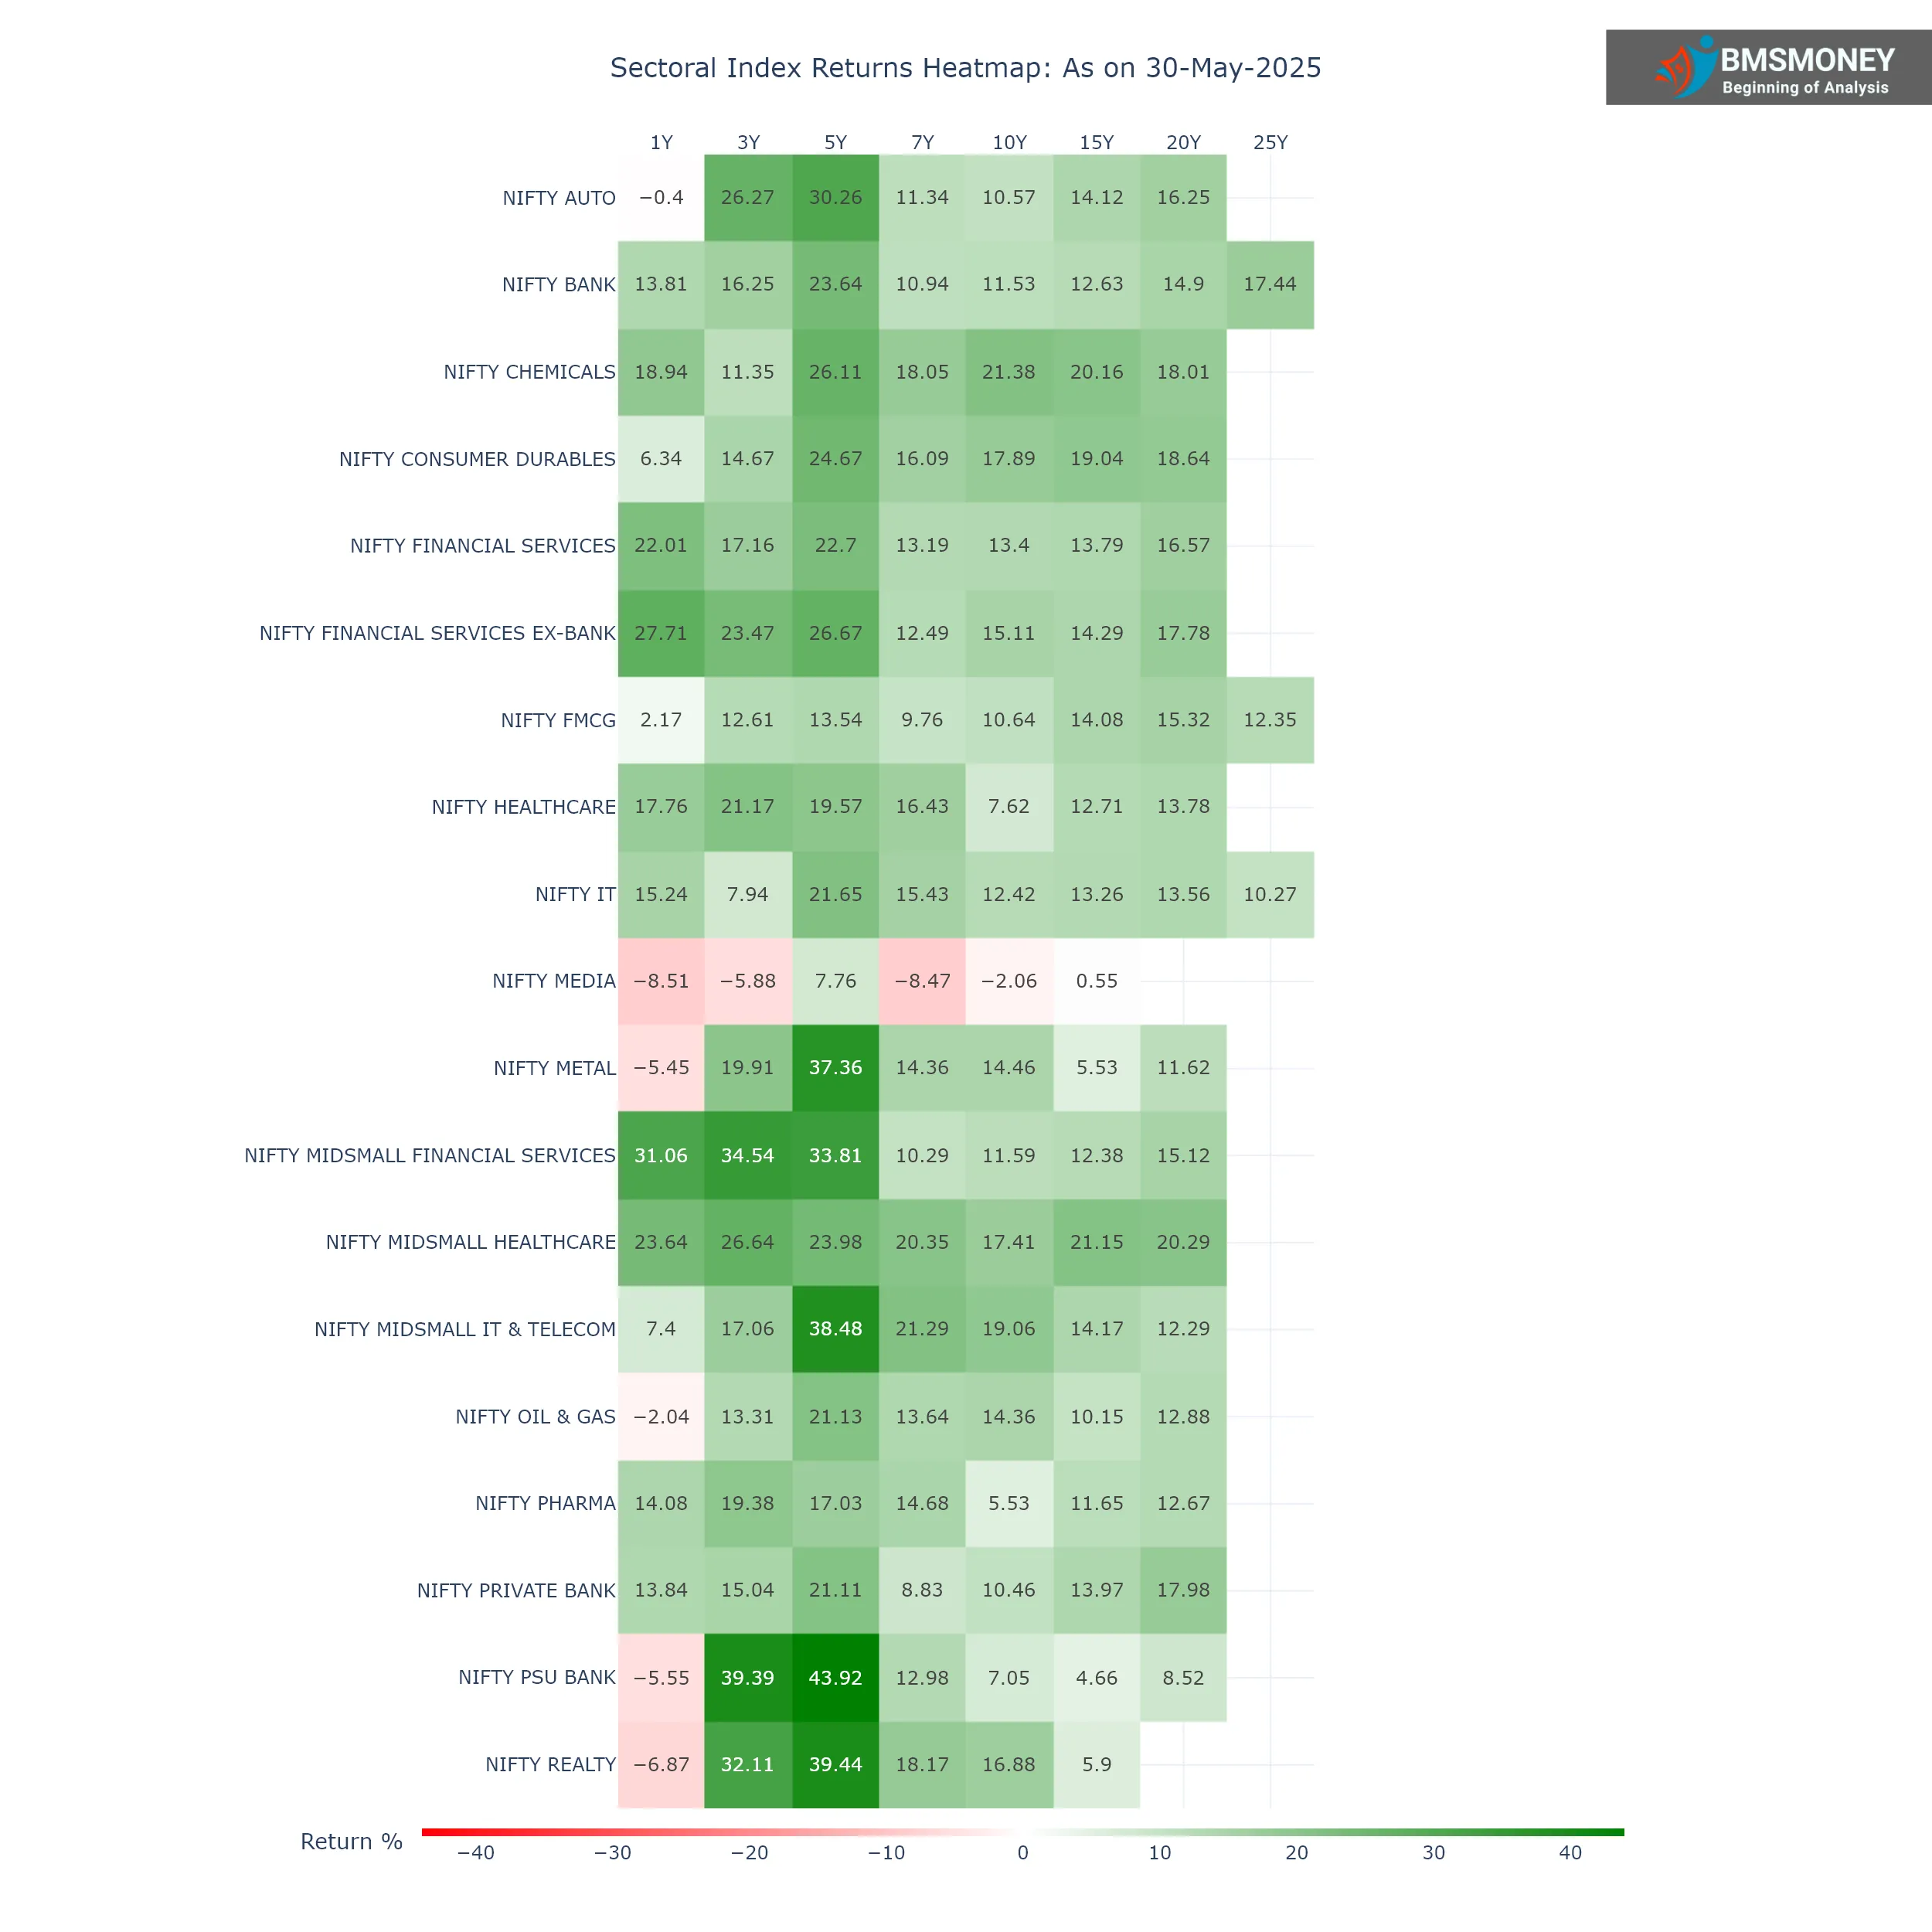
- Mid/Small Financials Dominated: 31% 1-year return, 34.5% 3-year CAGR – highest near-term growth.
- Media & Realty Struggled: Media fell -8.5% (1Y), Realty dropped -6.9% (1Y) amid headwinds.
- Long-Term Healthcare Winners: Mid/Small Healthcare delivered 20.4% 7Y CAGR, Chemicals 21.4% 10Y CAGR.
- PSU Banks: Sharp Reversal: Despite 44% 5Y CAGR, plunged -5.6% over the past year.
- Metals & Autos Corrected: Metals down -5.5% (1Y), Autos -0.4% (1Y) after strong multi-year runs.
Understanding the NIFTY Indices Framework
The NIFTY 500 encompasses the top 500 companies across sectors, offering a comprehensive view of India’s equity market. Key sectoral indices include:
-
Financials: NIFTY Bank, NIFTY Financial Services, NIFTY Private Bank, NIFTY PSU Bank
-
Technology & Consumption: NIFTY IT, NIFTY FMCG, NIFTY Consumer Durables
-
Cyclicals: NIFTY Metal, NIFTY Oil & Gas, NIFTY Realty, NIFTY Auto
-
Defensives: NIFTY Healthcare, NIFTY Pharma
-
Others: NIFTY Media
As we close May 2025, India’s equity markets reveal a tapestry of divergent sectoral performances. While long-term investors have reaped the rewards of compounding, recent volatility has reshuffled winners and losers. Drawing from the latest sectoral index data (as of 30 May 2025), this analysis uncovers critical trends, standout sectors, and cautionary tales.

The Big Picture: Compounding Pays, but Volatility Bites
Over extended horizons, India’s growth narrative shines. The NIFTY PSU BANK index delivered a blistering 43.92% 5-year CAGR, while NIFTY MIDSMALL IT & TELECOM (38.48% 5Y CAGR) and NIFTY METAL (37.36% 5Y CAGR) emerged as mid-term champions. Yet, 2024–25 proved turbulent: 10 of 18 sectors posted negative 1-year returns, signaling a shift in market sentiment.
Top Performers: Who’s Leading the Pack?
- Financial Services: Resilience & Dominance
- NIFTY MIDSMALL FINANCIAL SERVICES stole the spotlight with a 31.06% 1-year return and a staggering 34.54% 3-year CAGR. This reflects robust credit growth in tier-2/3 markets.
- NIFTY FINANCIAL SERVICES EX-BANK (27.71% 1Y) and NIFTY BANK (13.81% 1Y) also outperformed, underscoring India’s financialization wave.
- Long-term Takeaway: Banks and financials averaged 12–15% CAGRs over 15–25 years, proving their structural role in India’s economy.
- Healthcare & Chemicals: Steady Compounders
- NIFTY MIDSMALL HEALTHCARE surged 23.64% (1Y) and delivered 20.35% (7Y CAGR), buoyed by domestic API manufacturing and export demand.
- NIFTY CHEMICALS shone with 21.38% 10-year CAGR, benefiting from China+1 supply chain shifts.
- Long-term Takeaway: Healthcare and chemicals combined innovation with defensive demand, yielding 18–21% CAGRs over 10–15 years.
- IT & Telecom: Midcaps Outshine
- NIFTY MIDSMALL IT & TELECOM crushed peers with 38.48% 5-year CAGR and 21.29% 7-year CAGR, driven by cloud adoption and niche digital services.
- Large-cap NIFTY IT lagged (15.24% 1Y) but maintained 10–15% long-term CAGRs.
You May Like to Know
Struggling Sectors: Where’s the Pain?
- Media & Realty: Cyclical Headwinds
- NIFTY MEDIA was the worst performer: -8.51% (1Y), -5.88% (3Y CAGR), and -8.47% (7Y CAGR). Streaming disruption and ad-spend cuts ravaged traditional players.
- NIFTY REALTY fell -6.87% (1Y) despite strong 3–5 year returns (32.11% 3Y CAGR). High interest rates dampened residential demand.
- Metals & Autos: Cyclical Corrections
- NIFTY METAL dropped -5.45% (1Y) after a stellar 37.36% 5-year run, as global commodity prices cooled.
- NIFTY AUTO declined -0.4% (1Y) due to EV transition costs, though long-term margins held up (16.25% 20Y CAGR).
- PSU Banks: From Heroes to Zeroes?
- NIFTY PSU BANK crashed -5.55% (1Y) despite its 43.92% 5-year surge. Profit-booking and NPL concerns triggered this reversal.
Top Performing Funds for You
Top Performing Equity Funds Top Performing Debt Funds Top Performing Hybrid FundsLong-Term Wisdom: Time in Market > Timing Market
Compounding smoothed volatility for patient investors:
- NIFTY CONSUMER DURABLES and FMCG delivered 15–19% CAGRs over 15–25 years, proving consumption’s staying power.
- NIFTY PRIVATE BANK (17.98% 20Y CAGR) and NIFTY FINANCIAL SERVICES (16.57% 20Y CAGR) turned ₹1,000 into ₹26,000+ over two decades.
- Even laggards like NIFTY PHARMA (14.68% 7Y CAGR) rewarded holders who ignored short-term noise.
Key Takeaways for Investors
- Financialization Continues: Banking and financial services remain India’s growth engine, especially in smaller cities.
- Defensive Bets Shine: Healthcare and chemicals offer stability during downturns.
- Avoid Value Traps: Media’s consistent underperformance (-5% to -8% CAGRs) demands sector-wide reinvention.
- Cyclicals Need Timing: Metals, realty, and autos require strategic entry points after corrections.
- Midcaps Lead Innovation: Smaller players in IT, healthcare, and finance are outgrowing large-caps.
Top Performing Equity Fund Categories for You
Top Performing Large Cap Funds Top Performing Mid Cap Funds Top Performing Small Cap FundsConclusion: Balancing Patience and Pragmatism
As of May 2025, India’s markets are at a crossroads. Long-term trends—financial inclusion, digitalization, and manufacturing—still favor sectors like financials, IT, and chemicals. However, recent stress in PSU banks, autos, and commodities warns against complacency. For investors, the data reinforces timeless principles: diversify across compounders, avoid perpetually weak sectors, and leverage volatility. The next decade will belong to those who respect these numbers while looking beyond them.
*Data Source: NSE Sectoral Indices (30 May 2025). CAGR = Compound Annual Growth Rate.*