As of 27 February 2026, the Nifty 50 returns are:
- 1 year Return of NIFTY 50 13.8%
- 3 year Return of NIFTY 50 13.3%
- 5 year Return of NIFTY 50 11.6%
- 7 year Return of NIFTY 50 12.9%
- 10 year Return of NIFTY 50 13.7%
- 15 year Return of NIFTY 50 10.9%
- 20 year Return of NIFTY 50 11.1%
- 25 year Return of NIFTY 50 12.4%
Introduction
This analysis dissects the historical performance of India's benchmark NIFTY 50 index across a spectrum of investment durations, ranging from one year to thirty years. The core objective is to evaluate the critical relationship between an investor's time horizon, the volatility of returns, and the probability of achieving positive outcomes. By examining historical data, this report aims to provide actionable insights for investors and financial analysts seeking to understand the risk and reward profile of the Indian equity market. All data presented is based on historical performance, with returns and Compound Annual Growth Rates (CAGRs) calculated as of December 31st for each respective year. We begin by exploring the market's behavior over the shortest, and most volatile, timeframes.
As of 27 February 2026, the Nifty 50 returns are:
- 1 year Return of NIFTY 50 13.8%
- 3 year Return of NIFTY 50 13.3%
- 5 year Return of NIFTY 50 11.6%
- 7 year Return of NIFTY 50 12.9%
- 10 year Return of NIFTY 50 13.7%
- 15 year Return of NIFTY 50 10.9%
- 20 year Return of NIFTY 50 11.1%
- 25 year Return of NIFTY 50 12.4%
Key Findings
- The NIFTY 50 has delivered an average 1-year return of 17.4% with significant volatility (Std Dev: 35.3%), producing negative returns in 9 out of 35 years.
- As investment horizon increases, return predictability improves dramatically: negative years drop from 9/35 at 1-year to zero at 7-year and beyond.
- The 10-year CAGR has never fallen below 2.5% and averages 11.3%, demonstrating strong long-term wealth creation.
- Beyond 15 years, the average CAGR stabilises in the 11–12% range with very low standard deviation, confirming the power of compounding in Indian equities.
- The most recent 35-year CAGR (since 1991) stands at 12.7%, representing a nearly 65x wealth multiplication from inception.
- Short-term volatility (1–3 years) is high but mean-reverting; long-term investors are rewarded with consistent double-digit compounding.
Investment Implications
- Equity investments with a 7+ year horizon have historically generated positive returns 100% of the time on NIFTY 50.
- SIP investors benefit from rupee cost averaging, further smoothing short-term volatility.
- The risk-adjusted return profile strengthens materially after the 5-year mark.
| Date | 1Y Return | 3Y | 5Y | 7Y | 10Y | 15Y | 20Y | 25Y | 30Y | 35Y |
| 27-02-2026 | 13.8 | 13.32 | 11.62 | 12.86 | 13.68 | 10.9 | 11.09 | 12.41 | 11.38 | 12.73 |
| 28-02-2025 | 0.65 | 9.62 | 14.58 | 11.25 | 9.53 | 10.54 | 12.49 | 10.93 | 10.82 | |
| 29-02-2024 | 27.04 | 14.8 | 15.29 | 13.83 | 13.35 | 14.83 | 13.33 | 13.24 | 9.75 | |
| 28-02-2023 | 3.04 | 15.6 | 10.52 | 13.83 | 11.76 | 8.31 | 14.97 | 11.82 | 10.91 | |
| 28-02-2022 | 15.59 | 15.88 | 13.59 | 9.49 | 12.05 | 10.52 | 14.39 | 11.95 | 10.29 | |
| 26-02-2021 | 29.7 | 11.46 | 15.77 | 12.74 | 10.54 | 10.91 | 12.61 | 11.33 | 12.91 | |
| 28-02-2020 | 3.79 | 8.05 | 4.7 | 10.15 | 8.57 | 11.8 | 10.03 | 10.08 | ||
| 28-02-2019 | 2.86 | 15.6 | 11.45 | 10.44 | 14.59 | 12.68 | 12.74 | 8.67 | ||
| 28-02-2018 | 18.17 | 5.63 | 13.01 | 10.15 | 7.22 | 16.49 | 12.14 | 10.99 | ||
| 28-02-2017 | 27.09 | 12.26 | 10.52 | 8.79 | 9.02 | 14.65 | 11.54 | 9.64 | ||
| 29-02-2016 | -21.51 | 7.07 | 5.55 | 14.17 | 8.55 | 11.58 | 10.25 | 12.35 | ||
| 28-02-2015 | 41.82 | 18.24 | 12.58 | 7.91 | 15.52 | 11.87 | 11.47 | |||
| 28-02-2014 | 10.26 | 5.58 | 17.83 | 7.66 | 13.3 | 13.17 | 7.99 | |||
| 28-02-2013 | 5.72 | 4.97 | 1.74 | 9.2 | 18.27 | 11.85 | 10.49 | |||
| 29-02-2012 | 0.97 | 24.9 | 7.53 | 14.37 | 16.78 | 11.89 | 9.42 | |||
| 28-02-2011 | 8.35 | 0.7 | 11.64 | 16.78 | 14.72 | 11.86 | 14.12 | |||
| 26-02-2010 | 78.11 | 9.54 | 18.54 | 24.47 | 11.52 | 11.1 | ||||
| 27-02-2009 | -47.09 | -3.49 | 8.95 | 13.46 | 10.91 | 4.9 | ||||
| 29-02-2008 | 39.47 | 35.42 | 37.48 | 21.31 | 17.28 | 13.57 | ||||
| 28-02-2007 | 21.81 | 27.66 | 26.81 | 12.38 | 14.13 | 10.06 | ||||
| 28-02-2006 | 46.19 | 42.46 | 17.87 | 17.72 | 11.97 | 14.96 | ||||
| 28-02-2005 | 16.83 | 22.58 | 4.91 | 10.27 | 7.56 | |||||
| 27-02-2004 | 69.3 | 10.03 | 12.9 | 8.78 | 2.92 | |||||
| 28-02-2003 | -6.89 | -13.71 | 0.05 | 0.99 | 3.23 | |||||
| 28-02-2002 | -15.49 | 5.19 | 2.72 | 1.7 | 2.53 | |||||
| 28-02-2001 | -18.33 | 8.41 | 6.37 | 0.02 | 13.53 | |||||
| 29-02-2000 | 68.63 | 18.33 | 10.28 | 11.46 | ||||||
| 27-02-1999 | -7.49 | -0.38 | -6.17 | 1.42 | ||||||
| 27-02-1998 | 6.22 | 1.49 | 6.5 | 15.8 | ||||||
| 28-02-1997 | 0.62 | -9.55 | 2.35 | |||||||
| 29-02-1996 | -2.19 | 8.63 | 21.17 | |||||||
| 28-02-1995 | -24.8 | 4.5 | ||||||||
| 28-02-1994 | 74.3 | 52.57 | ||||||||
| 27-02-1993 | -12.95 | |||||||||
| 29-02-1992 | 134.06 | |||||||||
| 28-02-1991 | ||||||||||
| count | 35 | 33 | 31 | 29 | 26 | 21 | 16 | 11 | 6 | 1 |
| mean | 17.36 | 12.22 | 11.25 | 11.15 | 11.27 | 11.83 | 11.82 | 11.22 | 11.01 | 12.73 |
| std | 35.27 | 13.51 | 8.34 | 5.6 | 4.24 | 2.48 | 1.91 | 1.35 | 1.09 | |
| min | -47.09 | -13.71 | -6.17 | 0.02 | 2.53 | 4.9 | 7.99 | 8.67 | 9.75 | 12.73 |
| max | 134.06 | 52.57 | 37.48 | 24.47 | 18.27 | 16.49 | 14.97 | 13.24 | 12.91 | 12.73 |
| median | 8.35 | 9.62 | 11.45 | 11.25 | 11.86 | 11.85 | 11.84 | 11.33 | 10.86 | 12.73 |
| Positive Return Year Count | 26 | 29 | 30 | 29 | 26 | 21 | 16 | 11 | 6 | 1 |
| Negative Return Year Count | 9 | 4 | 1 | 0 | 0 | 0 | 0 | 0 | 0 | 0 |
📖 RECOMMENDED READS
Overview of the Data
The dataset provides returns for the Nifty 50 Index over multiple time horizons: 1-year returns and CAGR for 3, 5, 7, 10, 15, 20, 25, and 30 years, calculated annually from 1991 to 2025. The data includes statistical measures such as mean, standard deviation, minimum, maximum, and quartiles, offering a robust framework to evaluate the index's performance.
Statistical Summary Across All Horizons
The table below summarises key statistical metrics for each rolling return horizon. Return figures are expressed as CAGR (%) for periods above 1 year.
|
Horizon |
Avg CAGR |
Min |
Max |
Median |
Std Dev |
+ve Years |
-ve Years |
|
1-Year |
17.4% |
-47.1% |
+134.1% |
8.4% |
35.3% |
26/35 |
9/35 |
|
3-Year |
12.2% |
-13.7% |
+52.6% |
9.6% |
13.5% |
29/33 |
4/33 |
|
5-Year |
11.2% |
-6.2% |
+37.5% |
11.5% |
8.3% |
30/31 |
1/31 |
|
7-Year |
11.2% |
+0.0% |
+24.5% |
11.3% |
5.6% |
29/29 |
0/29 |
|
10-Year |
11.3% |
+2.5% |
+18.3% |
11.9% |
4.2% |
26/26 |
0/26 |
|
15-Year |
11.8% |
+4.9% |
+16.5% |
11.9% |
2.5% |
21/21 |
0/21 |
|
20-Year |
11.8% |
+8.0% |
+15.0% |
11.8% |
1.9% |
16/16 |
0/16 |
|
25-Year |
11.2% |
+8.7% |
+13.2% |
11.3% |
1.4% |
11/11 |
0/11 |
|
30-Year |
11.0% |
+9.8% |
+12.9% |
10.9% |
1.1% |
6/6 |
0/6 |
|
35-Year |
12.7% |
+12.7% |
+12.7% |
12.7% |
— |
1/1 |
0/1 |
Recent 5-Year Rolling Returns (2022–2026)
The table below provides a snapshot of the most recent five rolling-return data points across key investment horizons, illustrating how current market conditions affect each timeframe.
|
Year |
1Y |
3Y |
5Y |
7Y |
10Y |
15Y |
20Y |
25Y |
|
2026 |
+13.8% |
+13.3% |
+11.6% |
+12.9% |
+13.7% |
+10.9% |
+11.1% |
+12.4% |
|
2025 |
+0.7% |
+9.6% |
+14.6% |
+11.2% |
+9.5% |
+10.5% |
+12.5% |
+10.9% |
|
2024 |
+27.0% |
+14.8% |
+15.3% |
+13.8% |
+13.3% |
+14.8% |
+13.3% |
+13.2% |
|
2023 |
+3.0% |
+15.6% |
+10.5% |
+13.8% |
+11.8% |
+8.3% |
+15.0% |
+11.8% |
|
2022 |
+15.6% |
+15.9% |
+13.6% |
+9.5% |
+12.1% |
+10.5% |
+14.4% |
+11.9% |
- 2026 (YTD Feb): Strong 1Y return of 13.8% with 10Y CAGR of 13.7%, above the long-run average.
- 2025: Subdued 1Y return (0.7%) after the 2024 rally; 5Y CAGR at 14.6% remains healthy.
- 2024: Exceptional year with 27% 1Y return; multi-year CAGRs also elevated across the board.
- 2022: Despite global headwinds, 15Y CAGR remained solid at 10.5%, reflecting resilient long-run wealth creation.
Key Observation About NIFTY 50 Long-Term Return Analysis (27-Feb-2026)
1-Year Annual Returns (1992–2026)
Annual point-to-point returns reveal the full spectrum of NIFTY 50’s short-term volatility. The index has produced exceptional positive years (e.g., +134% in 1992, +78% in 2010) as well as deep drawdowns (-47% in 2009). This underscores why short-term equity exposure demands a high risk tolerance.
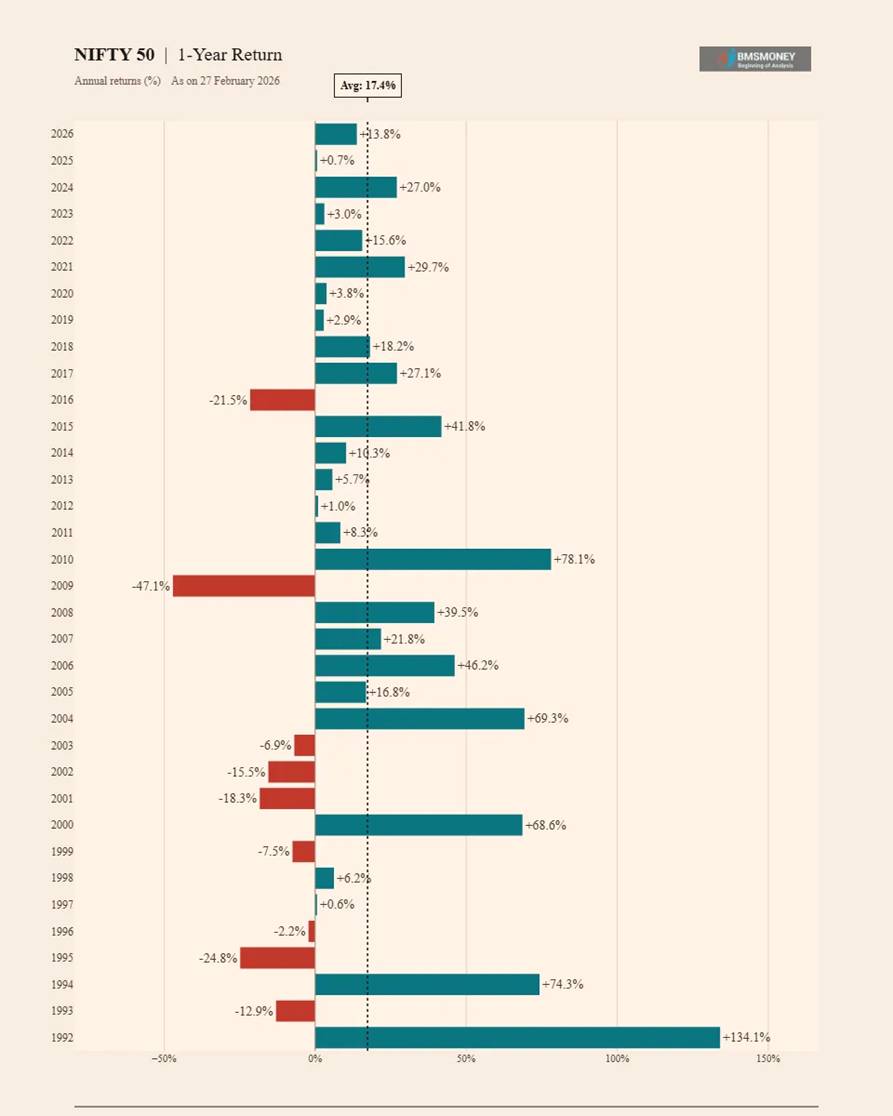
- Average 1-Year Return: 17.4% | Median: 8.4%
- Best Year: +134.1% (1992) | Worst Year: -47.1% (2009)
- 26 positive years vs. 9 negative years out of 35 observations.
- High standard deviation of 35.3% makes single-year outcomes highly unpredictable.
- Years following large drawdowns (2010 after 2009: +78.1%; 2004 after 2003: +69.3%) confirm mean-reversion tendency.
3-Year CAGR Returns (1994–2026)
Rolling 3-year CAGR smooths out single-year anomalies but still reflects meaningful cyclical risk. Negative observations drop to just 4 out of 33, and the worst 3-year CAGR (−13.7% ending Feb 2003) was linked to the dot-com bust and post-Kargil macro uncertainty.
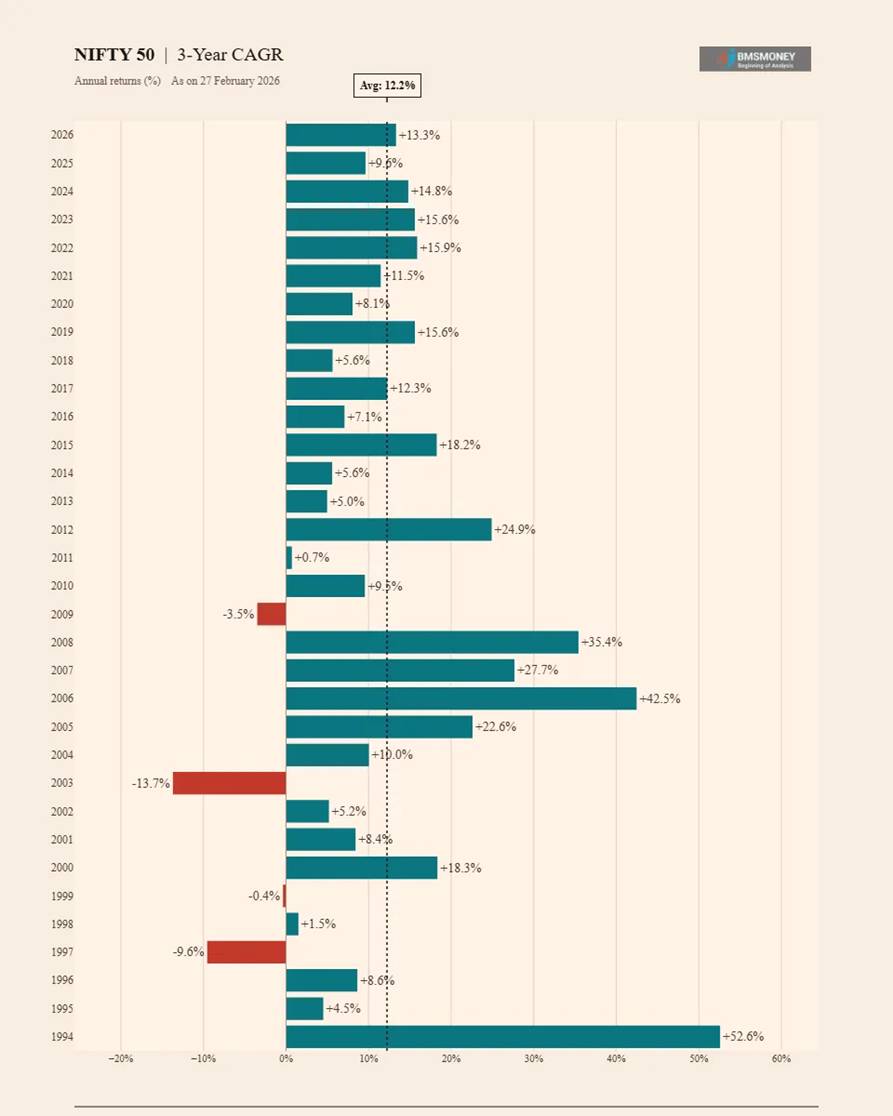
- Average 3-Year CAGR: 12.2% | Median: 9.6%
- Peak 3-Year CAGR: +52.6% (1994) driven by post-liberalisation bull run.
- Only 4 negative 3-year periods, all linked to global crises or domestic downturns.
- Post-2010 normalisation shows 3Y CAGRs clustering in the 8–16% range, reflecting a maturing market.
5-Year CAGR Returns (1996–2026)
The 5-year horizon marks a turning point in return reliability. Only a single negative observation exists (−6.2% ending Feb 1999, capturing the 1994–1999 sideways market), and the distribution tightens considerably around the long-run average.
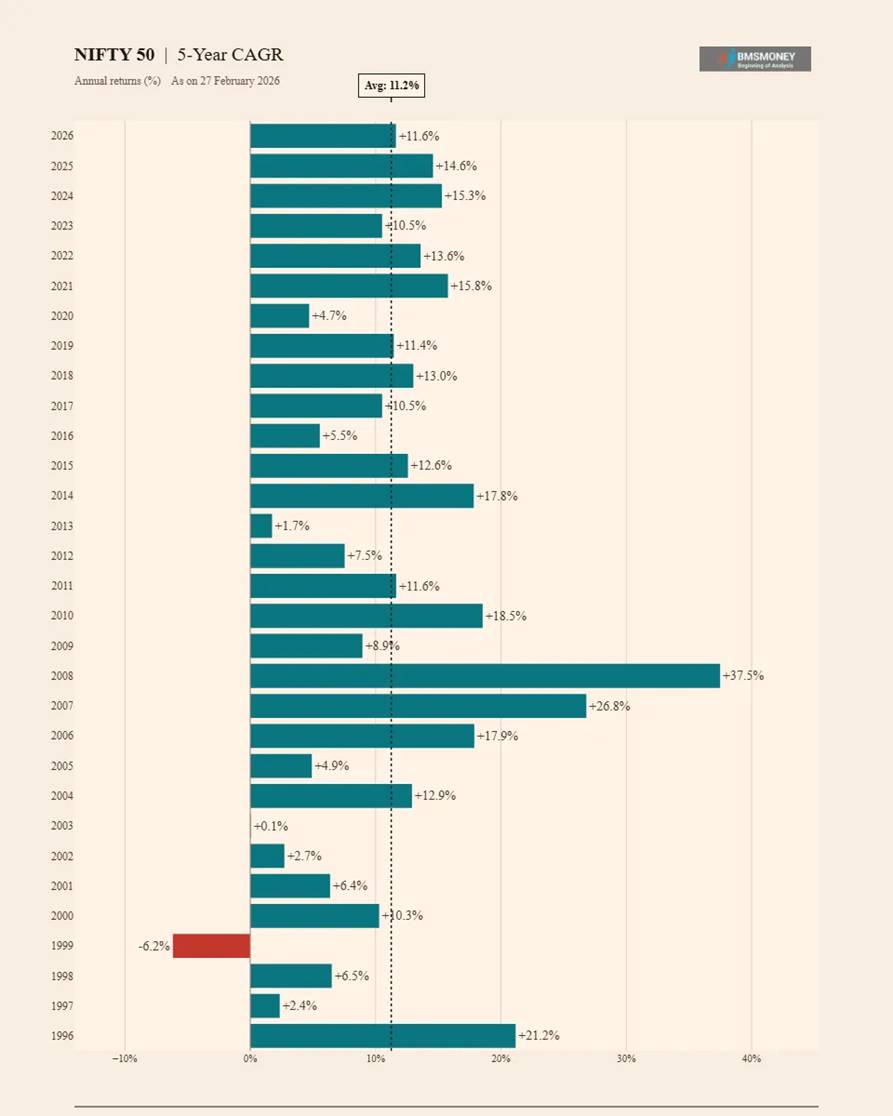
- Average 5-Year CAGR: 11.2% | Median: 11.5%
- Only 1 negative 5-year period in 31 observations (−6.2%, 1999).
- Peak of +37.5% (2008) captures the 2003–2008 mega-bull run.
- Standard deviation falls to 8.3%, a sharp improvement over shorter horizons.
- Post-2015 5Y CAGRs are stable in the 10–15% range, indicating a consistent growth trajectory.
7-Year CAGR Returns (1998–2026)
At seven years, NIFTY 50 has never delivered a negative CAGR across any rolling window in its 35-year history. This is a critical threshold for equity investors: a 7-year commitment has historically guaranteed positive real returns above inflation.
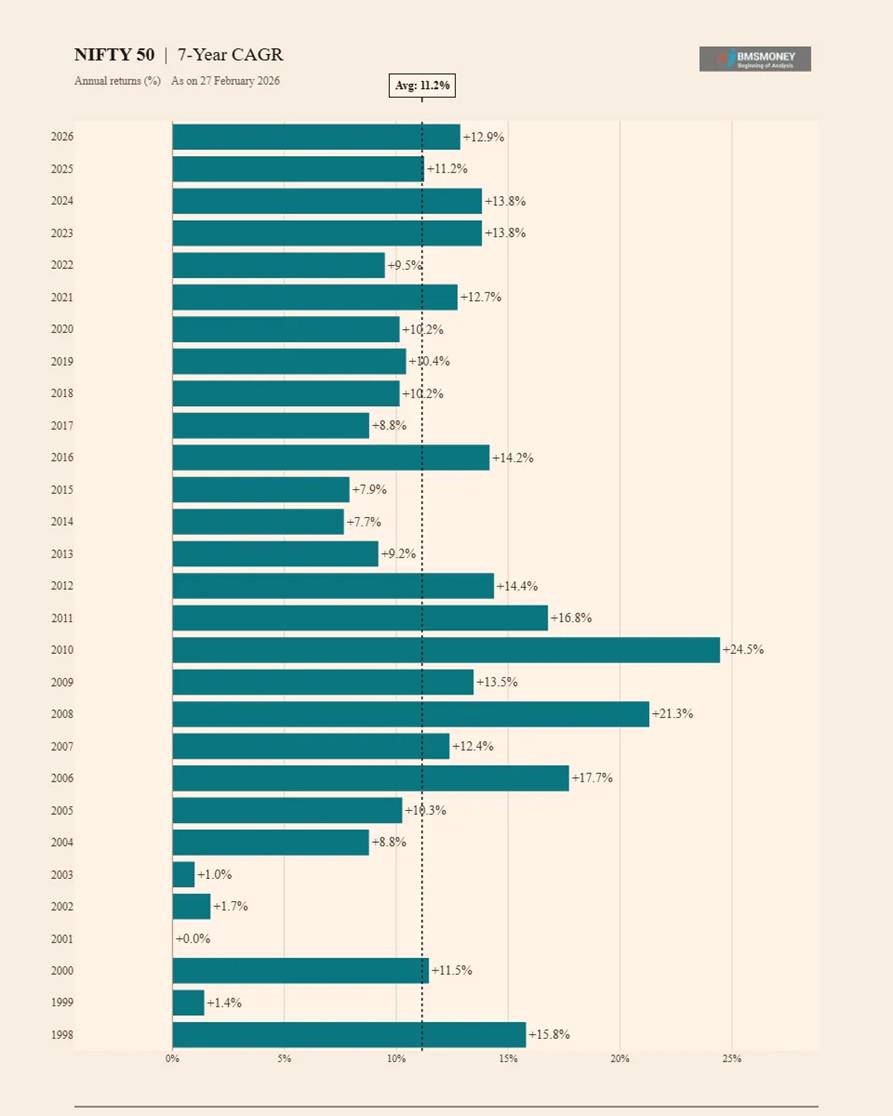
- Average 7-Year CAGR: 11.2% | Minimum: 0.0% (2001) | Maximum: 24.5% (2010)
- Zero negative return periods out of 29 observations.
- The 2010 peak (24.5%) reflects the powerful recovery from the 2003 low base.
- Recent 7Y CAGRs (2023–2026) are in the 11–14% range, near long-run averages.
- Low standard deviation of 5.6% indicates high return predictability at this horizon.
10-Year CAGR Returns (2001–2026)
The 10-year return profile exhibits strong central tendency around 11–12% CAGR with zero negative periods. This horizon is widely regarded as the minimum benchmark for equity mutual fund performance evaluation, and the data clearly justifies this convention.
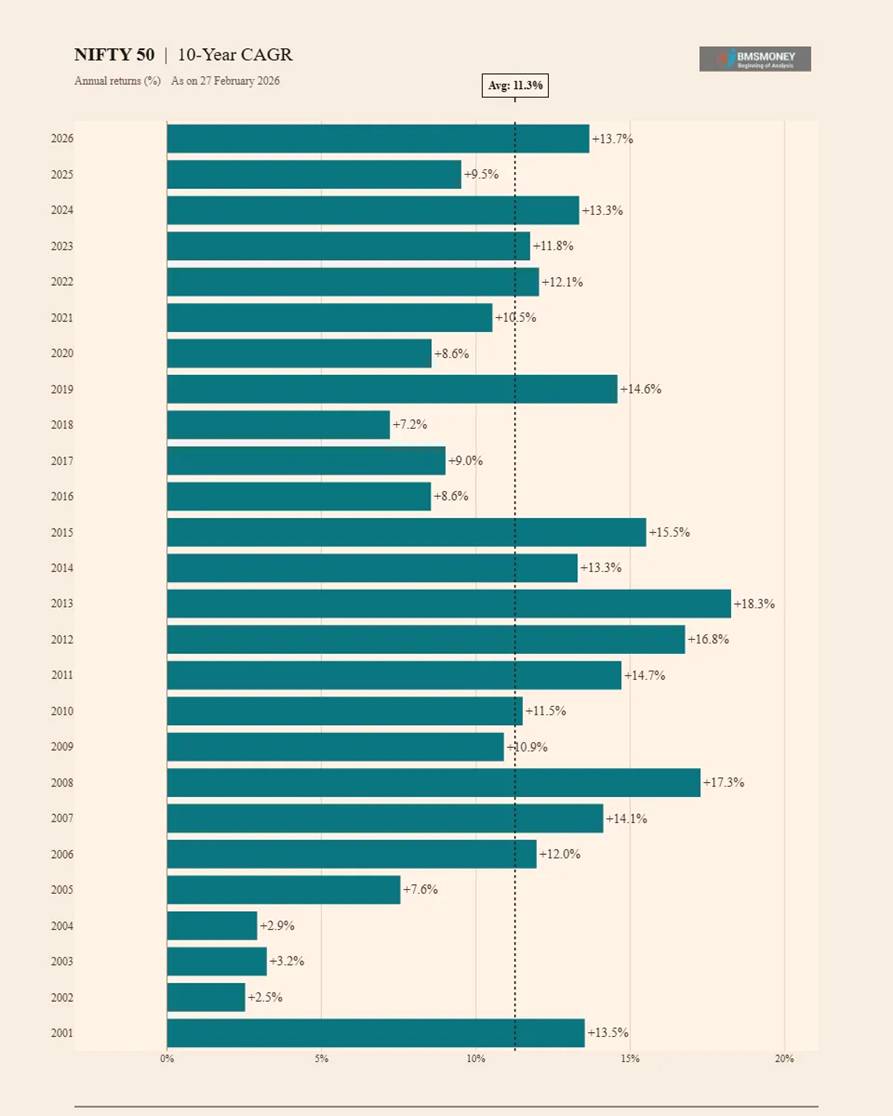
- Average 10-Year CAGR: 11.3% | Median: 11.9%
- Minimum: 2.5% (2002) | Maximum: 18.3% (2013) — all positive.
- The 2013 peak (18.3%) captures the sustained 2003–2013 bull market decade.
- Standard deviation of 4.2% confirms strong return clustering around the long-run mean.
- 2026 10Y CAGR of 13.7% is above average, reflecting the strong equity cycle post-2016.
15-Year CAGR Returns (2006–2026)
Over 15-year horizons, returns have remained remarkably stable in the 10–17% band, with virtually no dispersion relative to shorter periods. The only outlier is the 4.9% observation for Feb 2009, which captures a horizon starting during the 1994 peak and ending in the GFC trough.
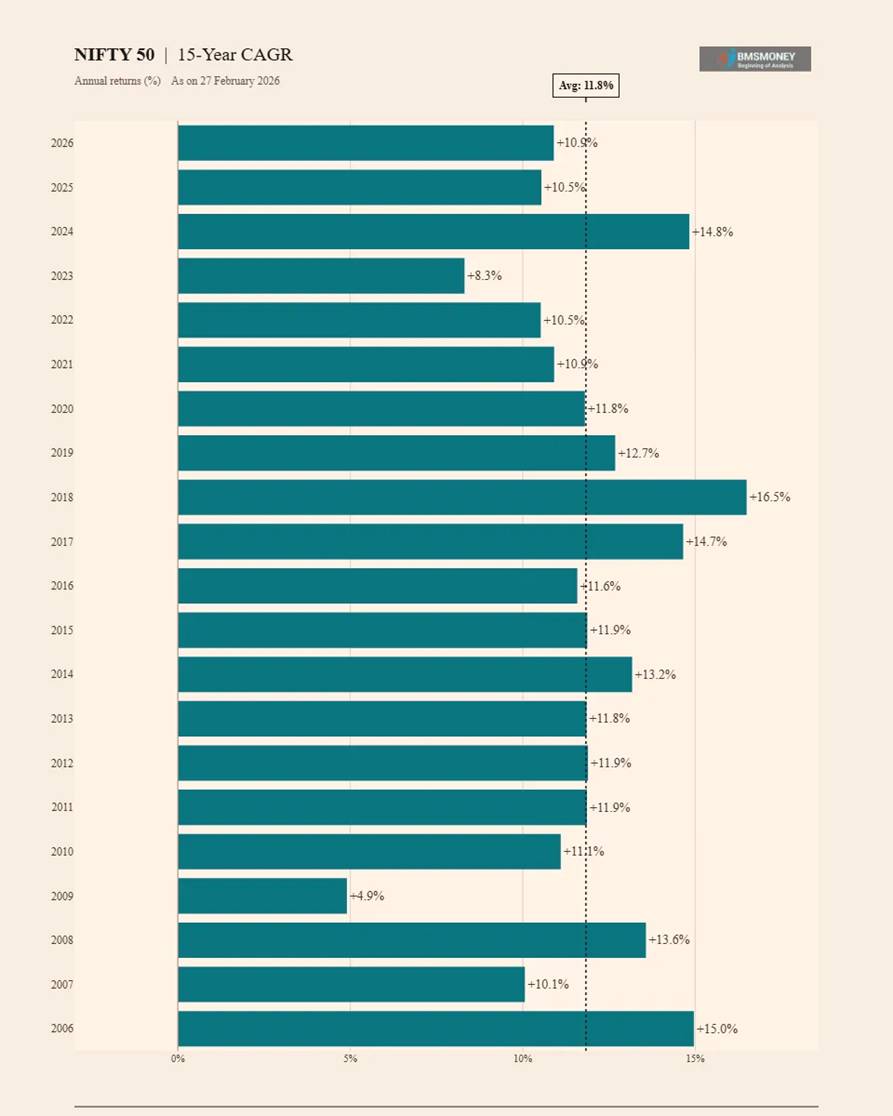
- Average 15-Year CAGR: 11.8% | Standard Deviation: just 2.5%
- Minimum: 4.9% (2009) | Maximum: 16.5% (2018)
- Peak 15Y CAGR of 16.5% (2018) covers the powerful 2003–2018 growth decade.
- Recent 15Y CAGRs (2024–14.8%, 2025–10.5%, 2026–10.9%) indicate slight moderation vs. peak but remain healthy.
20-Year CAGR Returns (2011–2026)
Twenty-year horizons show the highest return consistency, with all 16 observations positive and tightly clustered around the long-run mean. The standard deviation of just 1.9% demonstrates that decade-long economic cycles almost entirely cancel out over two-decade investment windows.
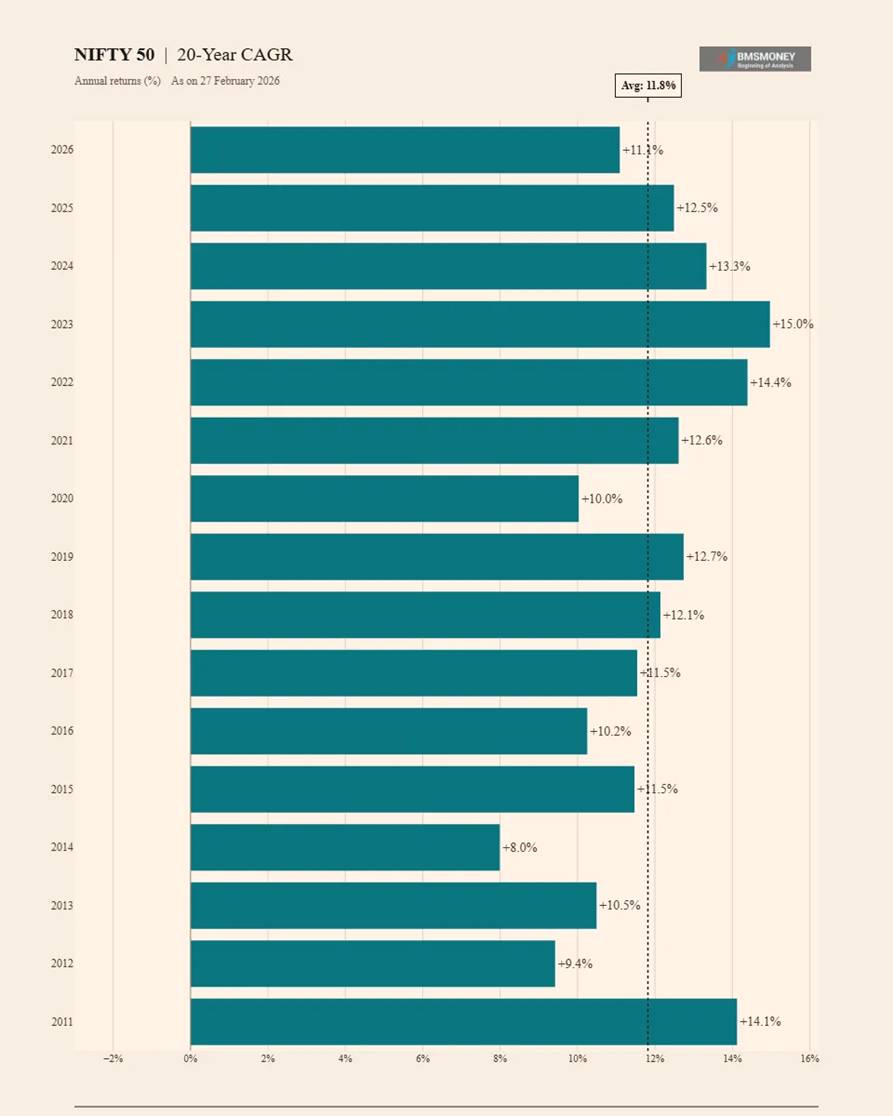
- Average 20-Year CAGR: 11.8% | Standard Deviation: 1.9% (lowest relative band)
- Minimum: 8.0% (2014) | Maximum: 15.0% (2023)
- All 16 observations between 8% and 15%, a remarkably tight range.
- The 2023 peak (15.0%) captures the sustained post-liberalisation growth (2003–2023).
- Current 20Y CAGR (2026): 11.1%, solidly within the historical range.
25-Year CAGR Returns (2016–2026)
Over 25 years, the NIFTY 50 has delivered CAGR returns in a narrow 8.7%–13.2% band. The 11-observation dataset demonstrates that despite dramatic events (Asian crisis, dot-com bust, GFC, COVID), long-term equity returns have been remarkably resilient and predictable.

- Average 25-Year CAGR: 11.2% | Standard Deviation: 1.4%
- Minimum: 8.7% (2019) | Maximum: 13.2% (2024)
- 25Y CAGR range is a tight 4.5 percentage points across all observations.
- Current 25Y CAGR (2026): 12.4%, above the long-run average, reflecting recent strong performance.
30-Year CAGR Returns (2021–2026)
With only 6 data points available (NIFTY 50 launched in 1991), the 30-year CAGR stands at approximately 11% on average. The data confirms that the index has compounded wealth at double-digit rates over three full decades of Indian economic transformation.
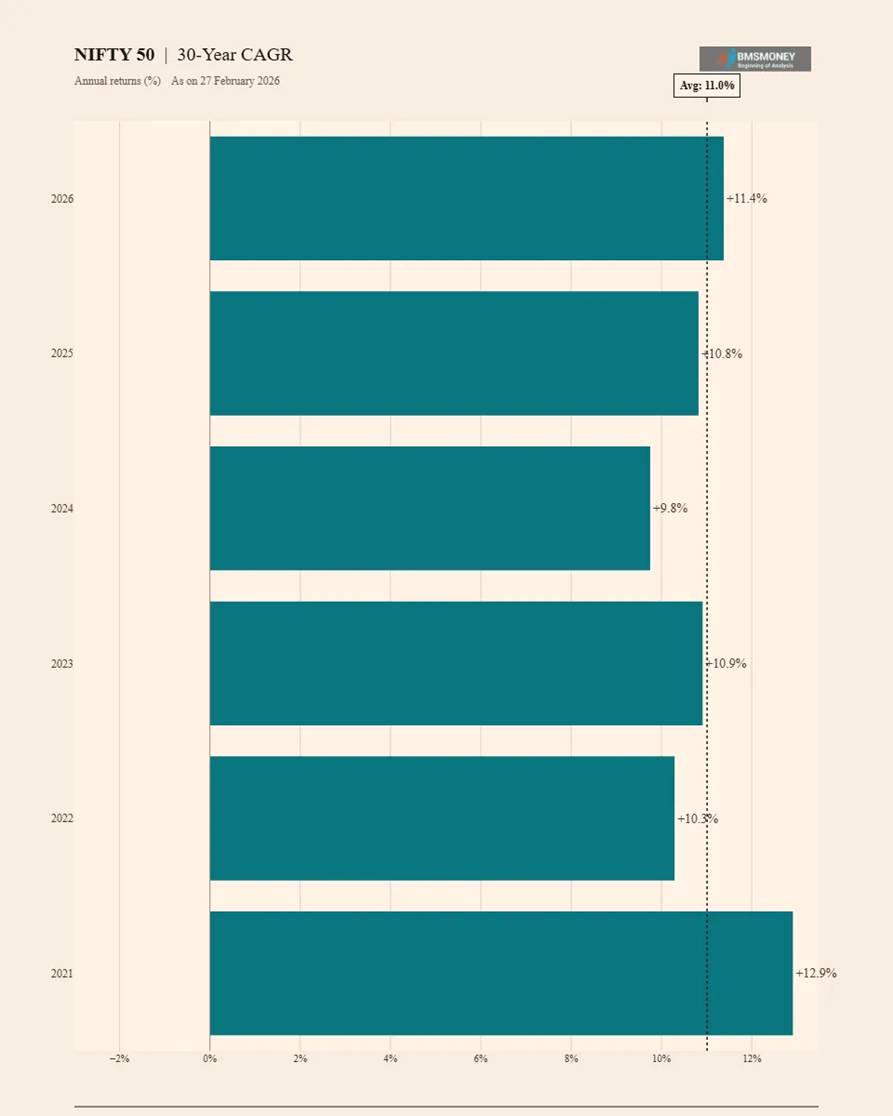
- Average 30-Year CAGR: 11.0% | Range: 9.8%–12.9%
- Standard Deviation: 1.1%, indicating extremely stable long-run compounding.
- The 2024 observation (9.8%) is the lowest, reflecting the 1994 starting point (near-peak valuations).
- 2026 observation: 11.4%, above the 6-year average, supported by post-2021 market strength.
35-Year CAGR Return (2026 Only)
The 35-year CAGR represents the entire history of the NIFTY 50 from its 1991 base. With a single data point of 12.7%, this figure captures the full arc of India’s post-liberalisation economic growth and equity market development.
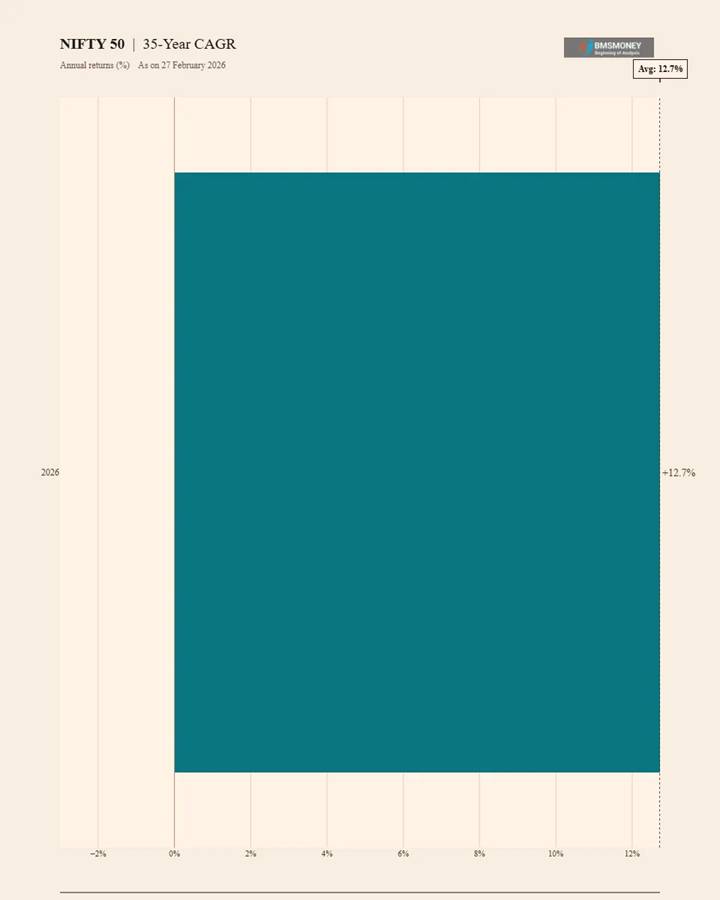
- 35-Year CAGR (1991–2026): 12.7% per annum
- An investment of ₹1 lakh in 1991 would have grown to approximately ₹64 lakhs by February 2026.
- This captures the full transformation of the Indian economy: liberalisation (1991), IT boom (2000s), infrastructure cycle (2003–2008), digital revolution (2014–present).
- 12.7% real + inflation compounds to significant nominal wealth; adjusted for ~5% average inflation, the real CAGR is approximately 7.3%.
Analytical Insights & Investor Takeaways
The Risk Compression Effect
One of the most striking findings of this analysis is the dramatic compression of risk as investment horizon extends. Standard deviation falls from 35.3% at 1-year to 1.1% at 30-year. This is not merely statistical averaging — it reflects the fundamental nature of equity as an asset class: short-term prices are driven by sentiment and liquidity, while long-term prices reflect underlying earnings growth and economic expansion.
The Negative Return Threshold
Investors who maintain a 7-year investment horizon have never experienced a negative CAGR on NIFTY 50 in any rolling window over 35 years. This is a powerful fact for financial advisors: the primary risk of equity investment is not permanent loss but insufficient holding period. Premature redemption driven by short-term volatility is the single largest destroyer of investor wealth.
Mean Reversion in Long-Term Returns
Across horizons from 10 to 30 years, the average CAGR consistently clusters in the 11–12% range, regardless of market cycles. This mean-reversion in long-run returns suggests that structural factors (nominal GDP growth + productivity gains) anchor equity returns over the very long run, even as cyclical factors create wide short-term dispersions.
Post-2003 Structural Shift
Rolling returns across multiple horizons show elevated CAGRs for windows ending in 2006–2008 (capturing the 2003–2008 bull run) and again in 2021–2026 (capturing the post-COVID recovery). The structural improvement in Indian corporate earnings quality, regulatory frameworks (SEBI reforms, GST, IBC) and RBI’s inflation targeting have likely raised the ‘floor’ of long-term NIFTY 50 returns.
Current Environment Assessment (Feb 2026)
- 1Y Return of +13.8% is in line with the long-run average, suggesting no particular overheating.
- 10Y CAGR of 13.7% is above the long-run average (11.3%), reflecting the strong decade from 2016–2026.
- 15Y CAGR of 10.9% and 20Y CAGR of 11.1% are slightly below their respective averages, indicative of a slightly subdued medium-term base effect.
- The overall picture suggests NIFTY 50 is fairly valued to modestly elevated on a long-term basis, with no evidence of extreme overvaluation or undervaluation.
Disclaimer
This report has been prepared by BMS Money Research for informational and educational purposes only. The data presented represents historical returns of the NIFTY 50 Index and is not a guarantee or projection of future performance. Past performance is not indicative of future results.
This report does not constitute investment advice, a solicitation to buy or sell securities, or a recommendation regarding any specific financial product. Investors should consult a SEBI-registered investment advisor before making any investment decisions. Equity investments are subject to market risks; please read all scheme-related documents carefully.
Data Source: BMS Money (BMSMoney.in) | Data as on: 27 February 2026
Index: NIFTY 50 | BSE/NSE historical data