As of 27 February 2026, the NIFTY SMALLCAP 250 returns are:
- 1 year Return of NIFTY SMALLCAP 250 14.7%
- 3 year Return of NIFTY SMALLCAP 250 21.2%
- 5 year Return of NIFTY SMALLCAP 250 18.2%
- 7 year Return of NIFTY SMALLCAP 250 18.3%
- 10 year Return of NIFTY SMALLCAP 250 16.1%
- 15 year Return of NIFTY SMALLCAP 250 13.2%
- 20 year Return of NIFTY SMALLCAP 250 12.2%
Introduction to NIFTY Smallcap Indices
The NIFTY Smallcap indices- comprising the NIFTY Smallcap 50, NIFTY Smallcap 100, and NIFTY Smallcap 250-are essential tools for tracking the performance of small-cap companies in the Indian stock market. These indices focus on smaller companies, which are known for their high growth potential but also come with higher volatility and risk compared to larger, more established companies.
-
NIFTY Smallcap 50: This index tracks the 50 smallest companies by market capitalization in the small-cap category. It provides insights into the performance of smaller, high-potential companies, though these companies tend to be riskier due to their size and market sensitivity.
-
NIFTY Smallcap 100: This index expands the coverage to the 100 smallest companies, offering a broader view of the small-cap market. It helps investors gauge the performance of a larger group of small companies, balancing risk and opportunity.
-
NIFTY Smallcap 250: The most comprehensive of the three, this index tracks the 250 smallest companies by market capitalization. It provides the widest perspective on the small-cap market, reflecting the performance of a diverse range of small companies.
Why Are These Indices Important?
-
Growth Opportunities: Small-cap companies are often in the early stages of growth, making them attractive for investors seeking high returns. The NIFTY Smallcap indices help identify these high-growth opportunities, especially during bullish market phases.
-
Diversification: Investing in small-cap indices allows investors to diversify their portfolios beyond large-cap and mid-cap stocks. This can be particularly beneficial when small-cap companies outperform during certain market cycles.
-
Market Sentiment: The performance of small-cap indices is often seen as an indicator of broader market sentiment. When these indices perform well, it typically signals that investors are willing to take on higher risk for potentially higher rewards.
-
Volatility and Risk: Small-cap stocks are known for their higher volatility, and the NIFTY Smallcap indices reflect this characteristic. They are useful for understanding the risk-return dynamics of the small-cap segment.
Risks Associated with Investing in Small-Cap Stocks
While small-cap indices offer exciting growth opportunities, they also come with significant risks that investors should be aware of:
-
Higher Volatility: Small-cap stocks tend to experience larger price swings compared to large-cap stocks. This volatility can lead to significant gains but also substantial losses, especially during market downturns.
-
Liquidity Risk: Small-cap stocks often have lower trading volumes, making it harder to buy or sell shares without affecting the stock price. This can be a challenge for investors looking to enter or exit positions quickly.
-
Business Risk: Small companies are more vulnerable to economic downturns, competition, and operational challenges. They may lack the financial stability and resources of larger companies, making them riskier investments.
-
Market Sensitivity: Small-cap stocks are more sensitive to changes in market sentiment and macroeconomic factors. Negative news or economic uncertainty can disproportionately impact small-cap companies.
-
Limited Track Record: Many small-cap companies are relatively new or have limited operating histories, making it harder to assess their long-term potential and stability.
In the below subsection, we will do a detailed performance analysis of each index which will include their return and risk analysis since 2005. This analysis will also help mutual fund investors in the risk-return profile of small-cap mutual funds as there is a dearth of data related to small-cap mutual funds which goes back up to 2005.
NIFTY Small Cap 250 Index Return Analysis
The NIFTY SmallCap 250 Index captures the pulse of India’s 250 most liquid small-capitalisation companies. From the euphoric 2007 bull market to the 2020 pandemic crash, the data reveal how different holding periods smooth (or accentuate) the ride. Below, we slice the 20-year history into six distinct lenses: 1-year, 3-year CAGR, 5-year CAGR, 7-year CAGR, 10-year CAGR, and 15-year CAGR.
| Date | 1Y Return | 3Y CAGR | 5Y CAGR | 7Y CAGR | 10Y CAGR | 15Y CAGR | 20Y CAGR |
| 31-12-2025 | -6.01 | 20.73 | 22.39 | 17.82 | 13.79 | 12.07 | 12.66 |
| 31-12-2024 | 26.43 | 21.74 | 29.59 | 13.68 | 15.62 | 13.67 | |
| 29-12-2023 | 48.1 | 32.21 | 21.53 | 17.28 | 19.06 | 17.72 | |
| 30-12-2022 | -3.65 | 24.97 | 5.56 | 10.94 | 13.51 | 6.05 | |
| 31-12-2021 | 61.94 | 22.94 | 16.43 | 13.09 | 17.68 | 11.15 | |
| 31-12-2020 | 25.09 | -5.65 | 5.8 | 13.84 | 7.24 | 9.59 | |
| 31-12-2019 | -8.27 | 1.83 | 3.15 | 8.93 | 6.46 | ||
| 31-12-2018 | -26.8 | 4.93 | 16.64 | 15.49 | 15.86 | ||
| 29-12-2017 | 57.28 | 20.27 | 22.06 | 13.29 | 6.3 | ||
| 30-12-2016 | 0.36 | 23.32 | 18.94 | 8.5 | 8.6 | ||
| 31-12-2015 | 10.2 | 19.74 | 8.7 | 20.89 | 11.54 | ||
| 31-12-2014 | 69.57 | 29.12 | 9.87 | 0.82 | |||
| 31-12-2013 | -8.14 | -6.71 | 15.09 | 2.85 | |||
| 31-12-2012 | 38.19 | 0.91 | -7.43 | 8.2 | |||
| 30-12-2011 | -36.03 | 16.74 | -0.84 | ||||
| 31-12-2010 | 16.25 | -8.39 | 14.46 | ||||
| 31-12-2009 | 113.92 | 8.84 | |||||
| 31-12-2008 | -69.08 | -7.56 | |||||
| 31-12-2007 | 94.95 | ||||||
| 29-12-2006 | 31.03 | ||||||
| 30-12-2005 | |||||||
| count | 20 | 18 | 16 | 14 | 11 | 6 | 1 |
| mean | 21.77 | 12.22 | 12.62 | 11.83 | 12.33 | 11.71 | 12.66 |
| std | 44.65 | 13.69 | 9.74 | 5.6 | 4.6 | 3.92 | |
| min | -69.08 | -8.39 | -7.43 | 0.82 | 6.3 | 6.05 | 12.66 |
| max | 113.92 | 32.21 | 29.59 | 20.89 | 19.06 | 17.72 | 12.66 |
| median | 20.67 | 18.24 | 14.78 | 13.19 | 13.51 | 11.61 | 12.66 |
| Positive Return Year Count | 13 | 14 | 14 | 14 | 11 | 6 | |
| Negative Return Year Count | 7 | 4 | 2 | 0 | 0 | 0 |
The analysis benchmarks NIFTY SMALLCAP 250 against both NIFTY MIDCAP 150 and NIFTY 50, enabling a full risk-return spectrum comparison. MIDCAP 150 data is sourced from the BMS Money NIFTY MIDCAP Index Performance Trends article; NIFTY 50 data from BMS Money's Decades of NIFTY 50 Performance article.
Key Findings
- NIFTY SMALLCAP 250 has delivered the highest average 1-year return (20.2%) but also the deepest worst-year loss (-65.3% in 2009), reflecting extreme return amplitude vs MIDCAP 150 (-60.8%) and NIFTY 50 (-47.1%).
- Negative 1-year return frequency is significantly higher for small-caps (8/20 = 40%) vs MIDCAP 150 (4/20 = 20%) and NIFTY 50 (9/35 = 26%), making small-cap the most demanding segment for behavioural discipline.
- Across 7-year to 20-year horizons, NIFTY SMALLCAP 250 records zero negative return periods, matching both MIDCAP 150 and NIFTY 50. The minimum 7-year return of +2.9% is lower than MIDCAP 150's +5.6% but above NIFTY 50's historical minimum of +0.0%.
- The most counterintuitive finding: at every horizon from 5 years to 20 years, MIDCAP 150 has outperformed SMALLCAP 250 on average return. The 10-year gap of 270 bps (15.2% vs 12.5%) challenges the assumption that higher risk always produces higher long-run returns.
- The 15-year average of 12.2% and 20-year figure of 12.2% are broadly in line with NIFTY 50 (11.8%/11.1%) but well below MIDCAP 150 (14.8%/14.2%), confirming mid-caps as the superior long-run compounder.
- The current 10Y return of +16.1% (Feb 2026) is 360 bps above the 10-year average of 12.5%, reflecting the strong 2016-2026 smallcap cycle.
Investment Implications
- Small-cap investing demands the longest horizon and strongest behavioural resolve: with 40% of 1-year periods negative, short-term investors face unacceptable odds.
- For patient long-term investors (10+ years), small-caps deliver a premium over large-caps but a smaller premium than mid-caps, suggesting mid-caps offer a superior risk-adjusted long-run profile.
- SIP investors benefit most from the volatile return pattern: deep drawdowns create favourable accumulation opportunities that drive long-term compounding.
Statistical Summary - NIFTY SMALLCAP 250
Key statistical metrics across all rolling horizons. All figures above 1 year represent CAGR. Data covers February year-end observations from 2007 to 2026.
|
Horizon |
Avg Return |
Min |
Max |
Median |
Std Dev |
+ve Years |
-ve Years |
|
1-Year |
20.2% |
-65.3% |
+142.6% |
10.0% |
44.4% |
12/20 |
8/20 |
|
3-Year |
12.2% |
-13.5% |
+32.5% |
15.7% |
13.7% |
13/18 |
5/18 |
|
5-Year |
12.6% |
-5.0% |
+25.0% |
12.9% |
8.5% |
15/16 |
1/16 |
|
7-Year |
11.9% |
+2.9% |
+19.4% |
11.1% |
4.9% |
14/14 |
0/14 |
|
10-Year |
12.5% |
+6.8% |
+19.9% |
12.2% |
4.1% |
11/11 |
0/11 |
|
15-Year |
12.2% |
+7.6% |
+19.5% |
11.2% |
4.1% |
6/6 |
0/6 |
|
20-Year |
12.2% |
+12.2% |
+12.2% |
12.2% |
N/A |
1/1 |
0/1 |
Note: Negative 1-year count of 8/20 (40%) is significantly higher than MIDCAP 150 (4/20 = 20%) and NIFTY 50 (9/35 = 26%), making small-cap the most volatile segment at short horizons.
3-Way Comparison: NIFTY 50 | MIDCAP 150 | SMALLCAP 250
Side-by-side comparison across all three indices. Blue = NIFTY 50, Teal = MIDCAP 150, Orange = SMALLCAP 250. Avg = average return; Min = worst rolling period; -ve = count of negative periods.
|
Horizon |
N50 Avg |
MC150 Avg |
SC250 Avg |
N50 Min |
MC150 Min |
SC250 Min |
N50 -ve |
SC250 -ve |
|
1-Year |
17.4% |
20.4% |
20.2% |
-47.1% |
-60.8% |
-65.3% |
9/35 |
8/20 |
|
3-Year |
12.2% |
14.5% |
12.2% |
-13.7% |
-14.8% |
-13.5% |
4/33 |
5/18 |
|
5-Year |
11.2% |
15.0% |
12.6% |
-6.2% |
-0.2% |
-5.0% |
1/31 |
1/16 |
|
7-Year |
11.2% |
14.7% |
11.9% |
+0.0% |
+5.6% |
+2.9% |
0/29 |
0/14 |
|
10-Year |
11.3% |
15.2% |
12.5% |
+2.5% |
+9.3% |
+6.8% |
0/26 |
0/11 |
|
15-Year |
11.8% |
14.8% |
12.2% |
+4.9% |
+10.8% |
+7.6% |
0/21 |
0/6 |
|
20-Year |
11.1% |
14.2% |
12.2% |
+8.0% |
+14.2% |
+12.2% |
0/16 |
0/1 |
Key Observations
- Return Ranking: At every horizon from 5 years to 20 years, MIDCAP 150 > SMALLCAP 250 > NIFTY 50 on average return. The mid-cap premium over small-caps ranges from 240 bps (5Y) to 270 bps (10Y) to 260 bps (15Y) - structurally consistent alpha.
- Downside Risk: Small-caps carry the deepest worst-case at every horizon up to 7 years. The 5-year minimum of -5.0% is meaningfully worse than MIDCAP 150's -0.2%, showing small-caps take longer to recover from major crashes.
- Negative Year Frequency: 8 negative 1-year periods in 20 years (40%) vs MIDCAP 150's 4/20 (20%). This is the single most important risk metric differentiating the two segments.
- The Mid-cap Dominance Paradox: MIDCAP 150 outperforms SMALLCAP 250 on long-run compounding despite being a lower-risk segment. The 2010-2020 small-cap bear decade is the primary explanation.
- Floor Returns at 10Y+: Small-cap floor (+6.8% at 10Y) is above NIFTY 50 (+2.5%) but below MIDCAP 150 (+9.3%), placing small-caps in the middle for worst-case long-term outcomes.
Recent 5-Year Rolling Returns (2022-2026)
NIFTY SMALLCAP 250 returns across all horizons for the five most recent annual observations.
|
Year |
1Y |
3Y |
5Y |
7Y |
10Y |
15Y |
20Y |
|
2026 |
+14.7% |
+21.2% |
+18.2% |
+18.3% |
+16.1% |
+13.2% |
+12.2% |
|
2025 |
-7.5% |
+15.9% |
+23.4% |
+10.8% |
+12.2% |
+12.1% |
N/A |
|
2024 |
+67.7% |
+29.5% |
+25.0% |
+16.0% |
+19.9% |
+19.5% |
N/A |
|
2023 |
+0.4% |
+22.7% |
+5.7% |
+13.9% |
+14.4% |
+7.6% |
N/A |
|
2022 |
+28.9% |
+21.9% |
+10.9% |
+10.7% |
+13.9% |
+10.4% |
N/A |
- 2026 (YTD Feb): +14.7% 1Y return - below MIDCAP 150 (+23.1%) and close to NIFTY 50 (+13.8%), suggesting small-cap relative underperformance in early 2026 after the 2024 surge.
- 2025: -7.5% - sharpest loss in recent history, worse than MIDCAP 150's -0.5%, reflecting small-cap's higher sensitivity to valuation corrections and FII outflows.
- 2024: +67.7% - standout year, substantially above MIDCAP 150's +56.3%, driven by the domestic small-cap re-rating cycle.
- 2022-2023 contrast: Strong 2022 (+28.9%) followed by near-flat 2023 (+0.4%) vs MIDCAP 150's +7.4%, illustrating small-cap's binary return pattern even in consecutive years.
1-Year Annual Returns (2007-2026)
Annual swings range from -65.3% (2009) to +142.6% (2010). Of 20 observations, 8 are negative (40%) - the highest loss frequency among the three indices. Yet extreme upcycles (2010, 2015, 2017, 2021, 2024) ensure the long-run average of 20.2% matches MIDCAP 150 despite higher loss frequency.
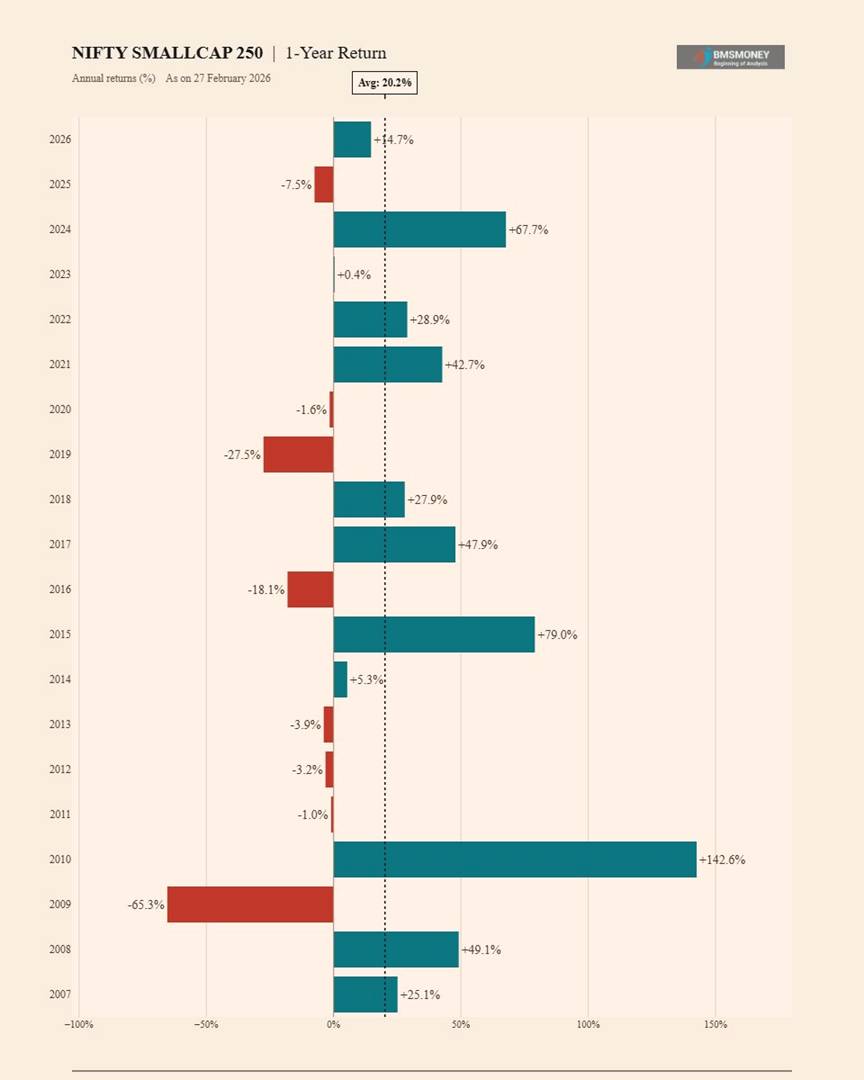
- Average 1-Year Return: 20.2% | Median: 10.0% (mean-median gap of 10.2% indicates heavy positive skew from outlier years).
- Best Year: +142.6% (2010, post-GFC recovery) | Worst: -65.3% (2009, GFC - worse than MIDCAP 150's -60.8% and NIFTY 50's -47.1%).
- 8 negative years out of 20 (40%) vs MIDCAP 150's 4/20 (20%) - the most important short-term risk differentiator.
- 2019 loss of -27.5% was unique to small-caps: MIDCAP 150 lost -12.1% and NIFTY 50 gained +2.9%, showing how small-cap sentiment can diverge sharply from the broader market.
- Standard deviation of 44.4% is the highest among all three indices, confirming small-cap as the most volatile segment of Indian listed equities.
3-Year Rolling Returns (2009-2026)
Rolling 3-year returns are the most volatile at this horizon: standard deviation of 13.7% vs MIDCAP 150's 12.4%, with 5 negative 3-year periods vs MIDCAP 150's 2. The average of 12.2% equals NIFTY 50's 3-year average but trails MIDCAP 150's 14.5%. Post-2021, the 3-year series has been consistently strong, all above 15%.

- Average 3-Year Return: 12.2% vs MIDCAP 150: 14.5% vs NIFTY 50: 12.2%.
- 5 negative 3-year periods (2009, 2011, 2014, 2020, 2021) vs MIDCAP 150's 2 - small-caps experienced extended multi-year pain through 2013-2021.
- Best 3-Year Window: +32.5% (2012) | Worst: -13.5% (2009).
- The 2022-2026 cluster shows all 3Y returns above 15%, the most sustained strong 3-year period in the index's history.
5-Year Rolling Returns (2011-2026)
At 5 years, only 1 negative period (-5.0% ending Feb 2013, capturing 2008-2013 bear market). From 2014 onwards, every 5-year window is positive. However, the 5-year average of 12.6% is notably below MIDCAP 150's 15.0% - small-caps do not outperform mid-caps on medium-term compounding despite higher volatility.
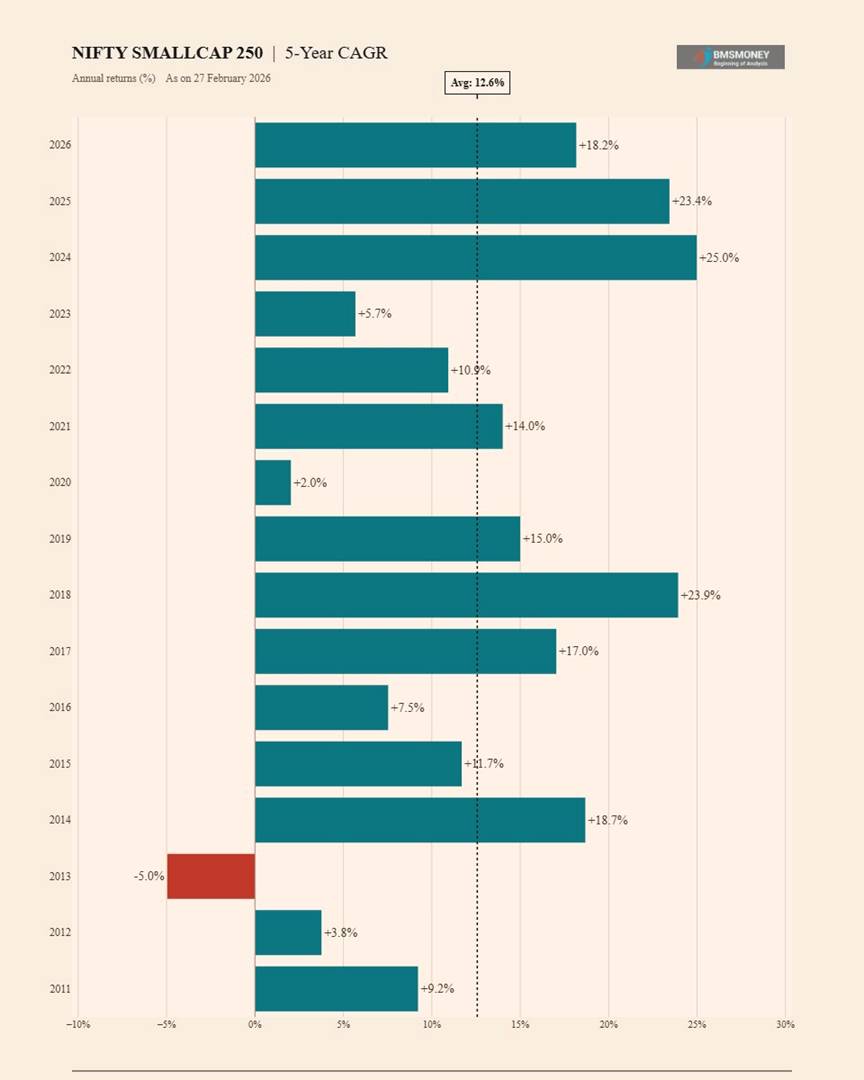
- Average 5-Year Return: 12.6% vs MIDCAP 150: 15.0% vs NIFTY 50: 11.2%.
- Only 1 negative period (-5.0%, 2013) out of 16, but this was worse than MIDCAP 150's single negative 5Y at -0.2%.
- Recent highs: +25.0% (2024) and +23.4% (2025), the strongest sustained 5-year compounding driven by the 2019-2026 bull cycle.
- The 2020 trough of +2.0% captures the 2015-2020 smallcap bear market - a lost five years that MIDCAP 150 largely avoided with its lowest 5Y at -0.2%.
7-Year Rolling Returns (2013-2026)
All 14 seven-year windows are positive. The minimum of +2.9% (2014) is the lowest floor among the three indices at this horizon. The average of 11.9% is slightly above NIFTY 50's 11.2% but well below MIDCAP 150's 14.7% - confirming that mid-caps compound more consistently over long periods.
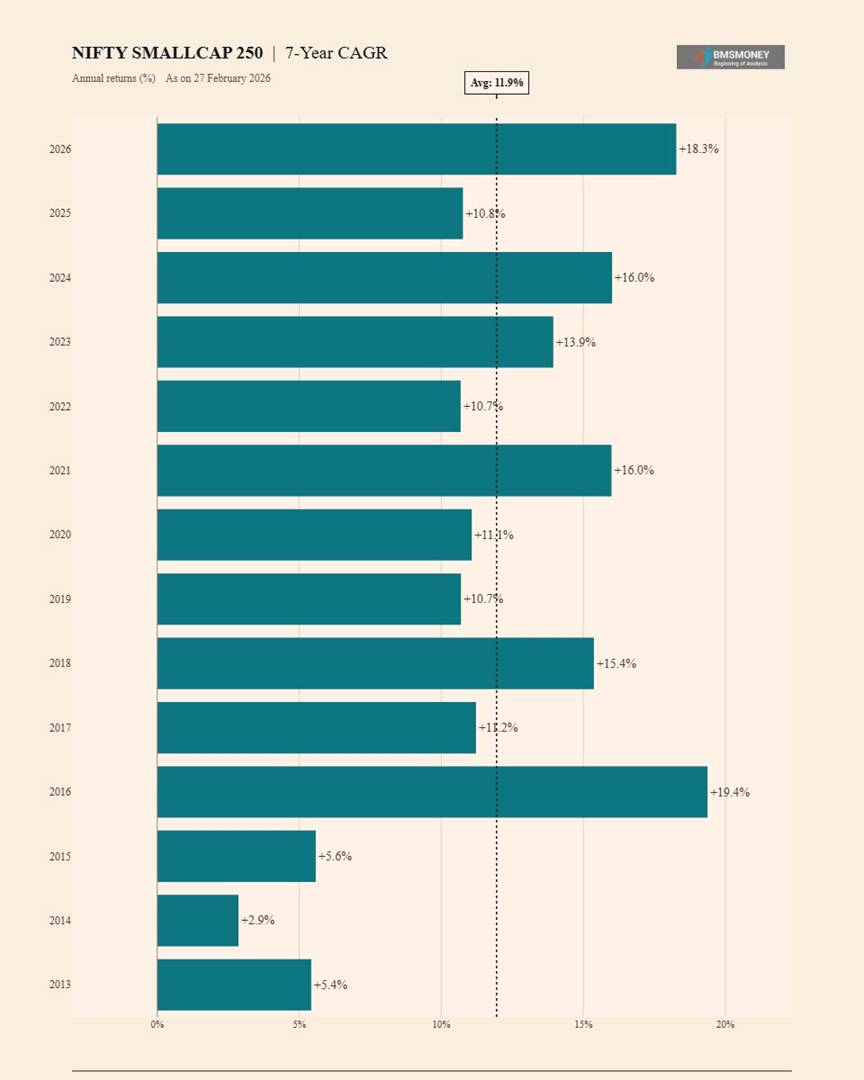
- Average 7-Year Return: 11.9% vs MIDCAP 150: 14.7% vs NIFTY 50: 11.2%.
- Zero negative return periods in all 14 observations, matching both MIDCAP 150 and NIFTY 50's 7-year record.
- Minimum floor: +2.9% (2014) - lowest 7-year floor among the three indices, reflecting the 2007-2014 period which included the GFC and a prolonged small-cap recovery.
- The 2026 high of +18.3% confirms that the 2019-2026 window has been exceptional for 7-year small-cap compounding.
10-Year Rolling Returns (2016-2026)
Ten-year rolling returns are entirely positive (11 out of 11), ranging from +6.8% to +19.9%. The average of 12.5% places small-caps above NIFTY 50 (11.3%) but well below MIDCAP 150 (15.2%). This is the most important finding: over a full decade, mid-caps have outperformed small-caps by nearly 3 percentage points per annum on average.
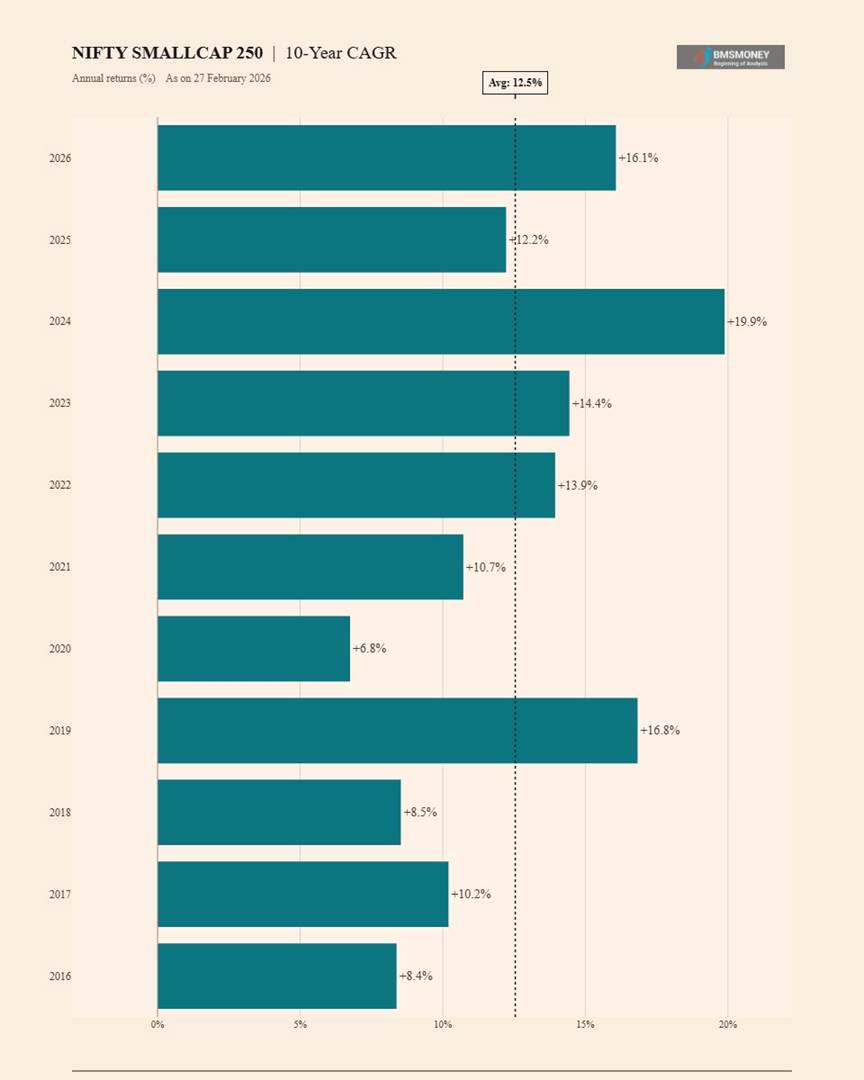
- Average 10-Year Return: 12.5% vs MIDCAP 150: 15.2% vs NIFTY 50: 11.3% (mid-caps lead by 270 bps over small-caps).
- Minimum: +6.8% (2020, capturing the 2010-2020 decade of small-cap underperformance) vs MIDCAP 150's minimum of +9.3%.
- Maximum: +19.9% (2024), reflecting the outstanding 2014-2024 small-cap decade.
- Current 10Y return of +16.1% is 360 bps above the 10-year average - mean reversion to 12-13% is likely over future windows.
15-Year Rolling Returns (2021-2026)
Six data points show a 7.6%-19.5% range with an average of 12.2% - meaningfully lower than MIDCAP 150's 14.8%. A 260 bps annual gap over 15 years composes to a dramatically larger wealth outcome for mid-cap investors. The minimum of +7.6% (2023) is the most cautionary data point in this series.
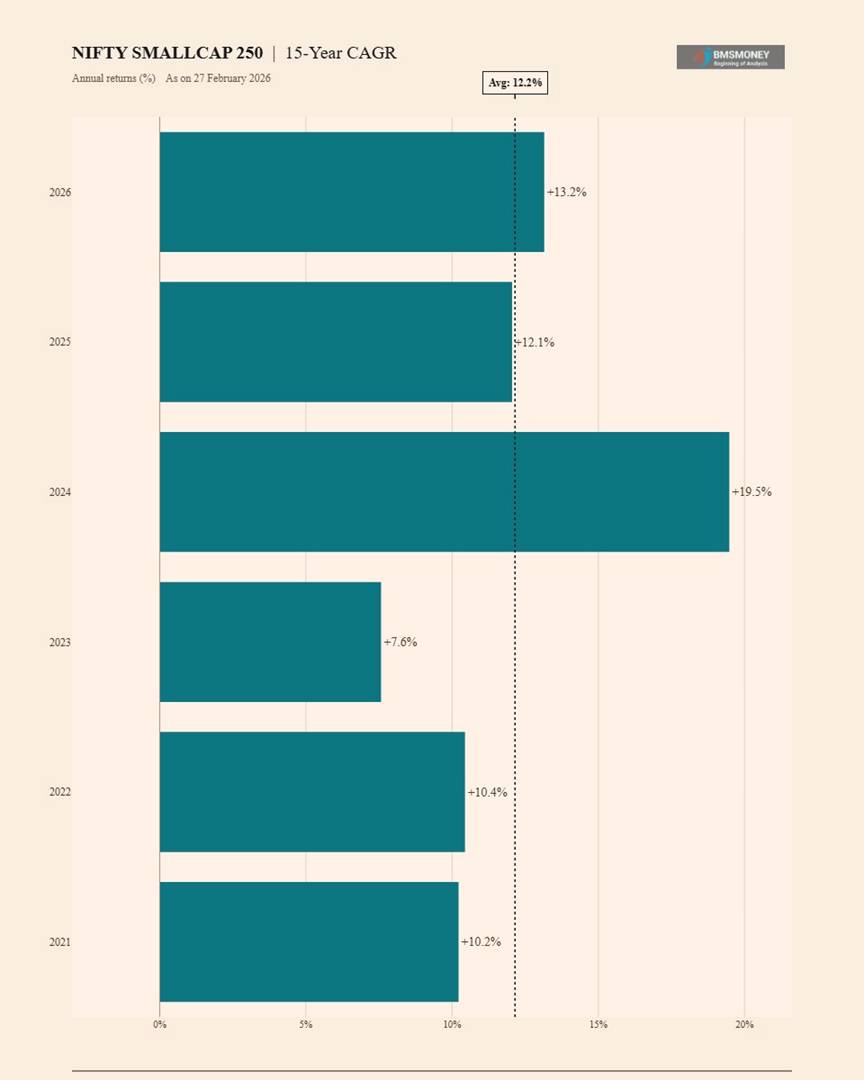
- Average 15-Year Return: 12.2% vs MIDCAP 150: 14.8% vs NIFTY 50: 11.8%.
- Minimum: +7.6% (2023, covering 2008-2023) vs MIDCAP 150's minimum of +10.8% - a 320 bps gap in worst-case outcomes at this horizon.
- Maximum: +19.5% (2024) - comparable to MIDCAP 150's +21.5%.
- The 2026 figure of +13.2% is slightly above the 6-observation average, indicating the 2011-2026 window has been modestly above-average for small-cap compounding.
20-Year Rolling Return (2026 Only)
The single 20-year data point (Feb 2026) shows a return of 12.2% per annum from 2006 to 2026. This compares to 14.2% for MIDCAP 150 and 11.1% for NIFTY 50. An investment of Rs 1 lakh in February 2006 would have grown to approximately Rs 9.9 lakhs in SMALLCAP 250, Rs 13.1 lakhs in MIDCAP 150, and Rs 8.0 lakhs in NIFTY 50.
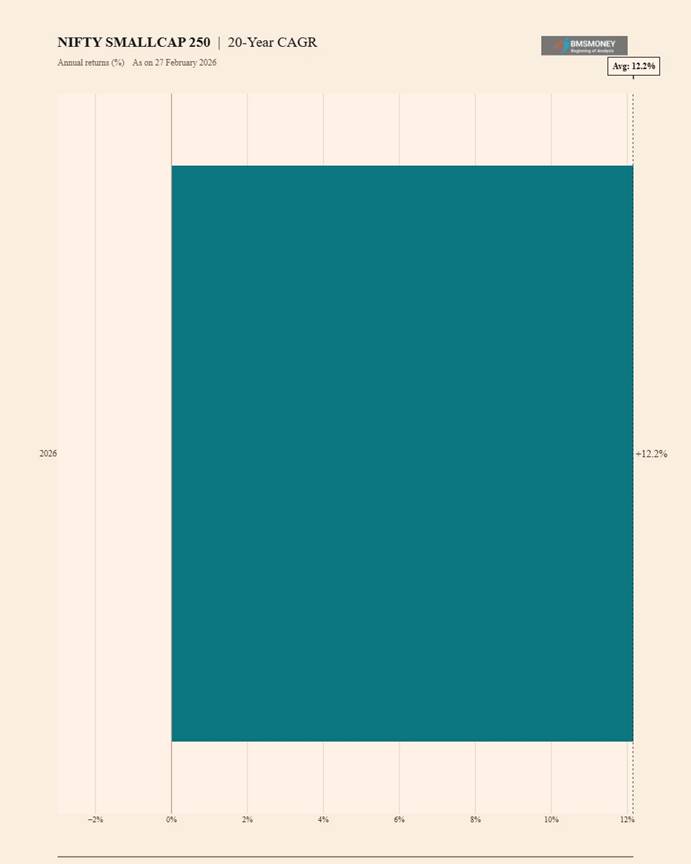
- 20-Year Return (2006-2026): +12.2% per annum vs MIDCAP 150: +14.2% vs NIFTY 50: +11.1%.
- Wealth creation: Rs 1 lakh grew to Rs 9.9 lakhs (SC250), Rs 13.1 lakhs (MC150), Rs 8.0 lakhs (N50) over 20 years.
- The 2.0 percentage point annual gap between SMALLCAP 250 and MIDCAP 150 compounds to a 32% larger terminal wealth for the mid-cap investor over 20 years.
- Small-caps are 110 bps above NIFTY 50 over 20 years - a modest premium over large-caps, at a significantly higher short-term volatility cost.
Analytical Insights & Investor Takeaways
The Mid-Cap Dominance Paradox
The most counterintuitive finding of this analysis is that NIFTY MIDCAP 150 has outperformed NIFTY SMALLCAP 250 at every long-term horizon from 5 years to 20 years. This defies the conventional risk-return intuition. The explanation lies in quality of compounding: mid-cap companies tend to be more institutionally owned, more liquid, and better governed than small-caps, leading to less severe multi-year bear cycles. The 2010-2020 period was particularly damaging for small-caps: near-zero compounding for a decade while mid-caps continued to grow strongly.
Risk-Return Spectrum: All Three Segments
- NIFTY 50: Lowest volatility, most consistent compounding (11-12%). Best for conservative long-term investors or those who cannot tolerate deep drawdowns.
- NIFTY MIDCAP 150: Superior long-run CAGR (14-15%) with manageable incremental risk. The risk-return sweet spot of Indian equity. Fewer negative years than small-caps despite better long-run returns, making it the most efficient segment.
- NIFTY SMALLCAP 250: Highest short-term volatility, highest loss frequency, but positive at all 7+ year horizons. Long-run compounding (12-13%) is above NIFTY 50 but below MIDCAP 150. Best as a satellite allocation within a diversified portfolio, not as a standalone core holding.
The Universal 7-Year Zero-Negative-Return Threshold
All three indices share a powerful characteristic: zero negative rolling return periods at the 7-year horizon and beyond. This consistency across large, mid, and small-cap segments is the most robust empirical case for long-term equity investing in India. Regardless of market-cap segment, a minimum 7-year commitment has historically guaranteed positive returns.
Current Positioning (Feb 2026)
- All three indices show current rolling returns (1Y to 10Y) above their long-run averages, indicating Indian equity markets are in an elevated return phase relative to history.
- SMALLCAP 250 current 10Y: +16.1% (360 bps above 12.5% avg); MIDCAP 150 current 10Y: +19.2% (400 bps above 15.2% avg); NIFTY 50 current 10Y: +13.7% (240 bps above 11.3% avg).
- Mean reversion suggests future 10-year returns may moderate: NIFTY 50 toward 10-12%, MIDCAP 150 toward 13-15%, SMALLCAP 250 toward 11-13%.
- Investors entering at current valuations should extend their horizon further (10+ years) to ensure sufficient runway for compounding to overcome near-term valuation risk.
Portfolio Construction Framework
An optimal long-term Indian equity portfolio (7+ year horizon) might consider: NIFTY 50 core (50-60%) for stability; MIDCAP 150 growth (25-30%) for enhanced CAGR; SMALLCAP 250 satellite (10-15%) for high-return optionality. This blended approach would historically have delivered approximately 13-14% CAGR over any 10+ year period, capturing the best of each segment while managing the extremes of small-cap concentration.
Disclaimer & References
This report has been prepared by BMS Money Research for informational and educational purposes only. All data represents historical index returns and does not guarantee future performance. This document does not constitute investment advice. Investors should consult a SEBI-registered investment advisor before making investment decisions. Equity investments are subject to market risk.
Data Sources
- BMS Money (bmsmoney.com) - Primary data source for NIFTY SMALLCAP 250 historical return calculations.
- NIFTY MIDCAP Index Performance Trends - BMS Money (https://www.bmsmoney.com/article/full/nifty-midcap-index-performance-trends/)
- Decades of NIFTY 50 Performance - BMS Money (https://www.bmsmoney.com/article/full/decades-of-nifty-50-performance-a-comprehensive-analysis-of-returns-from-1991-to-2024/)
- NSE India - NIFTY SMALLCAP 250 Index methodology. Data as on: 27 February 2026
Top Performing Funds for You
Top Performing Equity Funds Top Performing Debt Funds Top Performing Hybrid Funds| Horizon | Mean CAGR | Downside Risk | Best Use-Case |
|---|---|---|---|
| 1-Year | 21.77% | 35% negative | Tactical traders with strict stop-losses |
| 3-Year | 12.22% | 22% negative | Medium-term goals, STP into large-caps |
| 5-Year | 12.62% | 13% negative | Core SIP for aggressive portfolios |
| 7-Year | 11.83% | 0% negative | Education corpus, first-home down-payment |
| 10-Year | 12.33% | 0% negative | Retirement satellite, wealth compounding |
| 15-Year | 11.71% | 0% negative | Legacy planning, inter-generational transfer |
Top Performing Equity Fund Categories for You
Top Performing Large Cap Funds Top Performing Mid Cap Funds Top Performing Small Cap FundsFinal Word
The NIFTY SmallCap 250 is not a gentle ride, but it is a rewarding one for those who respect time. One-year punts resemble coin flips; stretch the clock to seven years and the coin lands heads every time. Allocate accordingly, diversify globally, and let the data—not headlines—drive your decisions.